서비스는 느려졌는데 CPU, 에러율, 지연 시간 중 무엇이 먼저 나빠졌는지 아무도 모릅니다. Kubernetes에서는 파드가 자주 바뀌기 때문에 정적 모니터링 설정만으로는 놓치는 대상이 생깁니다. Prometheus는 동적인 클러스터 환경에서 메트릭을 수집하고 알림의 근거를 제공합니다.
Kubernetes 모니터링 — Prometheus Operator와 Grafana
프로덕션 클러스터에서 "API가 느린 것 같다"는 제보가 들어왔습니다. 개발자들이 추측으로 서비스를 바라보는 동안, 모니터링 대시보드가 있다면 30초 안에 원인을 찾을 수 있습니다. 어느 서비스의 응답시간 P99가 튀었는지, 어느 파드의 CPU가 포화 상태인지, 에러율이 정상 범위를 벗어난 시점이 언제인지. Kubernetes 환경에서 파드는 수시로 재시작되고 IP가 바뀝니다. Prometheus Operator는 이 동적인 환경에서 수집 대상을 자동으로 추적합니다. ServiceMonitor 하나를 만들면 해당 서비스의 파드가 몇 개로 늘어나든 자동으로 수집 대상에 포함됩니다.
kube-prometheus-stack을 처음부터 설치하고 커스텀 애플리케이션의 메트릭을 수집하여 Grafana에서 시각화합니다. 알림 규칙 작성과 Alertmanager 라우팅까지 운영 환경 수준의 모니터링 스택을 구성합니다.
- 1kube-prometheus-stack으로 Prometheus Operator, Grafana, Alertmanager를 일괄 배포할 수 있다
- 2ServiceMonitor로 파드 메트릭 수집을 자동화할 수 있다
- 3PodMonitor와 ServiceMonitor의 차이를 설명할 수 있다
- 4PromQL의 rate(), sum(), by(), histogram_quantile()을 사용할 수 있다
- 5PrometheusRule로 알림 규칙을 코드로 관리할 수 있다
- 6Grafana 대시보드를 프로비저닝할 수 있다
kube-prometheus-stack은 Prometheus, Grafana, Alertmanager, 각종 exporter를 포함하여 약 1-2GB RAM이 필요합니다. 로컬 환경에서는 minikube를 --memory 4096 이상으로 시작하거나, kind 클러스터를 사용하세요.
kubectl cluster-infokubectl create namespace monitoringhelm repo add prometheus-community https://prometheus-community.github.io/helm-charts && helm repo updatekubectl top nodes 2>/dev/null || kubectl get nodes -o widehelm uninstall kube-prometheus-stack -n monitoring && kubectl delete namespace monitoring
모니터링 스택 전체 제거 — Prometheus·Grafana·Alertmanager 동시 삭제
안전한 실행 조건: kubectl config current-context 로 개발 클러스터인지 확인. 실습이 완전히 완료된 후에만 실행하세요. 보존할 Grafana 대시보드나 알림 규칙이 있다면 먼저 export하세요.
실행 전 반드시 확인
- kubectl config current-context 로 현재 컨텍스트가 개발 클러스터인지 확인
- helm list -n monitoring 으로 삭제 대상 릴리스 이름 확인
- 보존할 Grafana 대시보드가 있다면 JSON으로 export 먼저 완료
- 실습이 완전히 종료된 상태인지 확인
helm uninstall kube-prometheus-stack -n monitoring && kubectl delete namespace monitoring위 항목을 모두 확인한 후 복사할 수 있습니다
kube-prometheus-stack — 표준 모니터링 스택 배포
Prometheus를 직접 설치하고 Grafana를 별도로 설치하다 보면 버전 호환성 문제가 발생하고, Alertmanager 연동, exporter 추가, scrape 설정마다 파일을 수동으로 수정해야 합니다. 클러스터 컴포넌트 수가 늘어날수록 설정 파일이 비대해지고 누락이 생깁니다. kube-prometheus-stack은 이 모든 컴포넌트를 하나의 Helm Chart로 묶어 초기 설치와 업그레이드를 단순화합니다. Prometheus Operator가 포함되어 있어 이후 수집 대상 추가와 알림 규칙 관리를 Kubernetes 리소스(CRD)로 선언적으로 처리할 수 있습니다. 이 CB에서는 kube-prometheus-stack 설치와 기본 제공 대시보드 확인까지의 절차를 다룹니다. 개별 설치보다 훨씬 빠르게 프로덕션 수준의 모니터링 스택을 구성할 수 있습니다.
 확대
확대
스택 구성 요소
kube-prometheus-stack 설치 후 실행되는 컴포넌트입니다.
prometheus-operator— Prometheus/Alertmanager CRD Controllerprometheus— 메트릭 수집 및 저장 (StatefulSet)alertmanager— 알림 라우팅 및 그룹핑 (StatefulSet)grafana— 메트릭 시각화 (Deployment)kube-state-metrics— Kubernetes 오브젝트 상태 메트릭node-exporter— 노드 시스템 메트릭 (DaemonSet)prometheus-adapter— HPA용 커스텀 메트릭 API
설치
# values 파일 생성 (리소스 절약 설정)
cat > prometheus-values.yaml << 'EOF'
# Grafana 설정
grafana:
  service:
    type: NodePort              # 로컬 접근용 (프로덕션에서는 Ingress 사용)
  persistence:
    enabled: false              # 실습용 (프로덕션에서는 true)

# Prometheus 설정
prometheus:
  prometheusSpec:
    retention: 15d              # 메트릭 보존 기간
    storageSpec:
      volumeClaimTemplate:
        spec:
          resources:
            requests:
              storage: 10Gi
    # 모든 네임스페이스의 ServiceMonitor를 허용
    serviceMonitorSelectorNilUsesHelmValues: false
    podMonitorSelectorNilUsesHelmValues: false

# Alertmanager 설정
alertmanager:
  alertmanagerSpec:
    storage:
      volumeClaimTemplate:
        spec:
          resources:
            requests:
              storage: 2Gi
EOF

# 스택 설치
read -r -s GRAFANA_ADMIN_PASSWORD && echo
export GRAFANA_ADMIN_PASSWORD
helm install kube-prometheus-stack \
  prometheus-community/kube-prometheus-stack \
  --namespace monitoring \
  --create-namespace \
  -f prometheus-values.yaml \
  --set-string grafana.adminPassword="$GRAFANA_ADMIN_PASSWORD" \
  --wait \
  --timeout 10m

# 설치 확인
kubectl get pods -n monitoring
# NAME                                                     READY   STATUS
# alertmanager-kube-prometheus-stack-alertmanager-0        2/2     Running
# kube-prometheus-stack-grafana-7d9f6b8d4c-xk2p9          3/3     Running
# kube-prometheus-stack-kube-state-metrics-xxx             1/1     Running
# kube-prometheus-stack-operator-xxx                       1/1     Running
# prometheus-kube-prometheus-stack-prometheus-0            2/2     Running
# kube-prometheus-stack-prometheus-node-exporter-xxx       1/1     Running  (각 노드)
- kubectl get pods -n monitoring에서 prometheus와 grafana 파드가 Running/READY인지 먼저 확인 — prometheus StatefulSet은 2/2(prometheus 컨테이너+config-reloader)여야 정상
- Prometheus UI(/targets)에서 State=UP 타겟 수를 확인 — 0이면 ServiceMonitor selector가 일치하는 서비스가 없는 것. 타겟은 있지만 State=DOWN이면 파드의 /metrics 엔드포인트 미구현 또는 RBAC 문제
- Grafana 대시보드에서 "No data"이고 타겟은 UP이면 → PromQL 시간 범위 또는 레이블 필터 불일치. 쿼리에서 job= 레이블 값을 Prometheus /targets에서 실제 job 이름으로 대조 확인
Grafana 접근
# NodePort로 접근 (minikube/kind)
kubectl get svc -n monitoring kube-prometheus-stack-grafana
# NAME                              TYPE       CLUSTER-IP    PORT(S)
# kube-prometheus-stack-grafana     NodePort   10.96.x.x     80:32xxx/TCP

# minikube의 경우
minikube service kube-prometheus-stack-grafana -n monitoring

# 또는 포트포워딩으로 접근
kubectl port-forward -n monitoring svc/kube-prometheus-stack-grafana 3000:80 &
# → http://localhost:3000 접속 (admin / 입력한 GRAFANA_ADMIN_PASSWORD)
기본 제공되는 대시보드 확인
Grafana 로그인 후 Dashboards → Browse:
  - Kubernetes / Cluster       — 클러스터 전체 리소스 사용률
  - Kubernetes / Nodes         — 노드별 CPU/Memory/Disk
  - Kubernetes / Workloads     — Deployment/DaemonSet 상태
  - Kubernetes / Pods          — 파드별 상세 메트릭
  - Kubernetes / Namespaces    — 네임스페이스별 리소스
  - Node Exporter / Full       — 노드 상세 시스템 메트릭
메트릭이 수집돼 경보가 되기까지 — 발견부터 통지까지 5단계
스택을 깔았으니 이제 "메트릭이 어떻게 화면과 알림까지 오는가"를 한 장으로 꿰어봅니다. Prometheus는 앱이 보내주길 기다리는 게 아니라 스스로 긁어오고(pull), 그 값을 저장했다가 규칙으로 평가해 경보를 냅니다. 이 파이프라인을 단계로 알아두면 "메트릭이 안 보인다", "알림이 안 온다·폭탄이다"가 각각 어느 단계 문제인지 바로 짚을 수 있습니다.
[Operator]  ServiceMonitor 생성  (selector: app=sample-app)
   │
   ① 서비스 디스커버리   (Operator가 SM→Service→Endpoints를 scrape 대상으로 변환)
   │    → 타깃 목록이 /service-discovery 에 등장 (파드 IP 자동 추적)
   │
   ② 주기적 Scrape       (scrape_interval마다 각 타깃의 GET /metrics 를 HTTP pull)
   │    → 성공 시 up{...}=1, /targets 에서 State=UP
   │
   ③ 라벨 부착 + TSDB 저장 (job·instance·pod 라벨을 붙여 시계열 샘플로 append)
   │
   ④ 룰 평가(PromQL)     (evaluation_interval마다 alerting rule 식을 계산)
   │    → 조건이 for 기간만큼 참이면 alert가 Pending→Firing
   │
   ⑤ Alertmanager 통지   (Firing 알림을 push → 그룹화·억제·음소거·라우팅)
   ▼
[결과]  Slack·PagerDuty 로 묶인 통지 1건
각 단계에서 무슨 일이 일어나고, 막히면 어떤 증상인가:
| 단계 | 하는 일 | 여기서 막히면 |
|---|---|---|
| ① 디스커버리 | Operator가 ServiceMonitor→Service→Endpoints를 scrape config로 변환해 타깃 자동 발견 | SM의 release 레이블·selector·port 이름이 안 맞으면 타깃이 안 잡힘(/service-discovery의 Dropped) |
| ② Scrape | scrape_interval마다 타깃의 /metrics를 HTTP GET으로 pull하고 up을 기록 | 앱이 /metrics 미노출·포트 오류면 State=DOWN(connection refused·404) |
| ③ 저장 | 샘플에 job·instance·pod 등 라벨을 붙여 TSDB에 시계열로 append | 요청 id·전체 URL 같은 고유값을 라벨로 넣으면 카디널리티 폭증 → 메모리·쿼리 폭발 |
| ④ 룰 평가 | evaluation_interval마다 PromQL 식을 계산하고 for 지속 시 Firing | 라벨 필터·job 이름이 실제와 다르면 식이 비어 알림이 영영 안 뜸 |
| ⑤ 통지 | Firing 알림을 Alertmanager가 그룹화·억제·음소거 후 채널로 라우팅 | group_by 없이 두면 파드 100개의 같은 알림이 100건으로 쏟아짐 |
즉 "메트릭이 안 보인다"는 대개 수집 앞단(①②)의 selector·포트·/metrics 문제이고, "알림이 안 온다 · 폭탄이 온다"는 뒷단(④⑤)의 PromQL·group_by 문제입니다. Prometheus UI를 /service-discovery(발견)→/targets(UP/DOWN)→/config(변환)→/rules(평가) 순으로 따라가면 어느 단계에서 끊겼는지 바로 좁혀집니다.
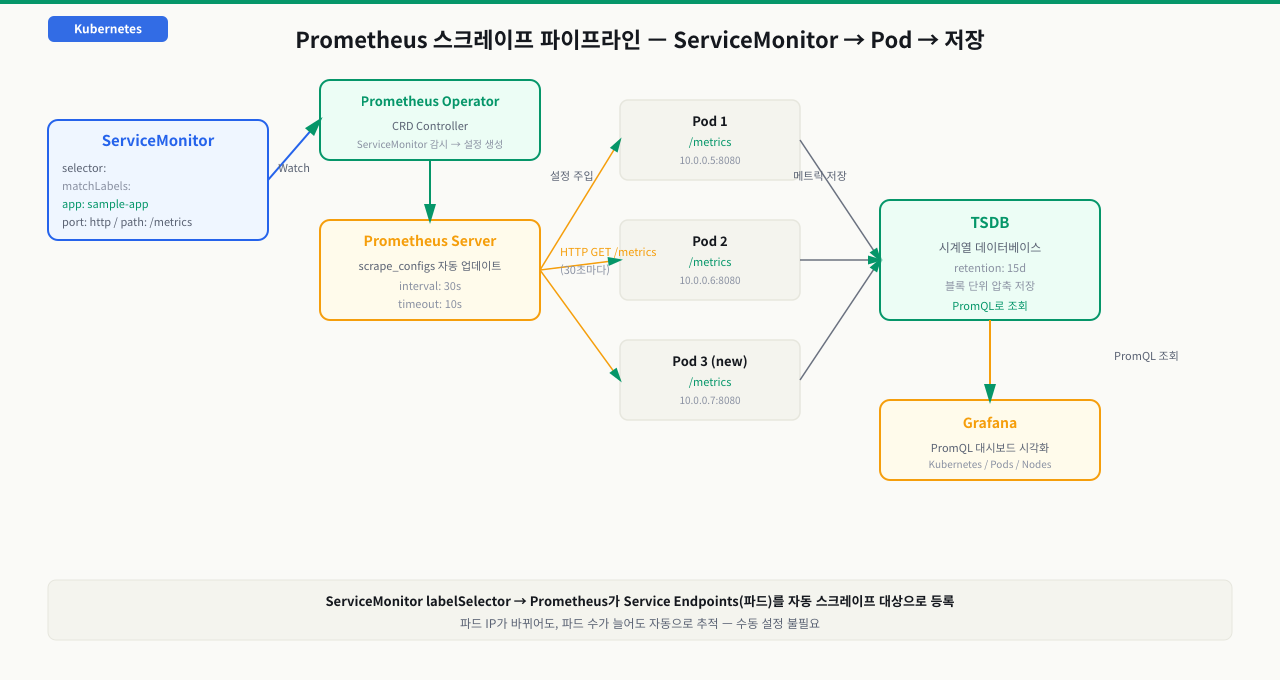
ServiceMonitor — 파드 메트릭 자동 수집 설정
새로운 마이크로서비스를 배포할 때마다 prometheus.yml의 scrape_configs를 수동으로 수정하고 Prometheus를 재시작하거나 reload를 보내야 합니다. 파드 IP가 바뀌면 수집이 끊기고, 새 파드가 추가되면 설정을 또 변경해야 합니다. 서비스가 수십 개를 넘어서면 이 방식은 유지보수가 불가능해집니다. ServiceMonitor는 이 문제를 해결합니다. Prometheus Operator의 핵심 가치는 ServiceMonitor입니다. 기존 Prometheus에서 파드를 추가하려면 prometheus.yml의 scrape_configs를 수동으로 수정하고 재로드해야 했습니다. ServiceMonitor는 이를 Kubernetes 리소스로 선언하면 Operator가 자동으로 Prometheus 설정에 반영합니다.
 확대
확대
메트릭을 노출하는 샘플 애플리케이션 배포
# sample-app.yaml — /metrics 엔드포인트가 있는 nginx
apiVersion: apps/v1
kind: Deployment
metadata:
  name: sample-app
  namespace: default
  labels:
    app: sample-app
spec:
  replicas: 2
  selector:
    matchLabels:
      app: sample-app
  template:
    metadata:
      labels:
        app: sample-app
        version: "1.0"
    spec:
      containers:
        - name: app
          image: quay.io/brancz/prometheus-example-app:v0.3.0
          ports:
            - name: http
              containerPort: 8080
          resources:
            requests:
              cpu: 50m
              memory: 32Mi
---
apiVersion: v1
kind: Service
metadata:
  name: sample-app
  namespace: default
  labels:
    app: sample-app              # ServiceMonitor가 이 레이블로 찾음
spec:
  selector:
    app: sample-app
  ports:
    - name: http                 # 포트 이름이 ServiceMonitor의 port와 일치해야 함
      port: 8080
      targetPort: 8080
ServiceMonitor 정의
# servicemonitor-sample.yaml
apiVersion: monitoring.coreos.com/v1
kind: ServiceMonitor
metadata:
  name: sample-app
  namespace: default
  labels:
    release: kube-prometheus-stack  # Prometheus가 이 레이블로 ServiceMonitor를 선택
spec:
  # scrape할 Service를 레이블로 선택
  selector:
    matchLabels:
      app: sample-app              # Service의 labels.app: sample-app

  # 여러 네임스페이스에 걸친 Service 선택 (기본: 동일 네임스페이스)
  namespaceSelector:
    matchNames:
      - default
      - production

  # scrape 엔드포인트 설정
  endpoints:
    - port: http                   # Service의 port 이름과 일치
      path: /metrics               # 메트릭 경로 (기본값)
      interval: 30s                # scrape 간격
      scrapeTimeout: 10s           # 타임아웃
      # TLS 설정 (HTTPS 엔드포인트의 경우)
      # tlsConfig:
      #   insecureSkipVerify: true
kubectl apply -f sample-app.yaml
kubectl apply -f servicemonitor-sample.yaml

# Prometheus UI에서 타겟 확인 (약 1분 후)
kubectl port-forward -n monitoring svc/prometheus-kube-prometheus-stack-prometheus 9090:9090 &
# → http://localhost:9090/targets 접속
# status=UP으로 표시되면 수집 중
PodMonitor vs ServiceMonitor
# Service 없이 파드를 직접 scrape할 때 PodMonitor 사용
apiVersion: monitoring.coreos.com/v1
kind: PodMonitor
metadata:
  name: batch-jobs
  namespace: default
  labels:
    release: kube-prometheus-stack
spec:
  selector:
    matchLabels:
      app: batch-processor
  podMetricsEndpoints:
    - port: metrics                # 파드 containerPort 이름
      path: /metrics
      interval: 60s               # 배치 잡은 긴 간격

# ServiceMonitor: Service → Endpoints를 통해 파드 자동 추적
# PodMonitor:     Service 없이 파드를 직접 레이블로 선택
PromQL 기본 — 메트릭 조회와 집계
Grafana에서 메트릭을 보려는데 쿼리 박스 앞에서 막힙니다. Counter는 계속 증가하는 숫자라 그냥 쓰면 의미가 없고, Histogram에서 P99를 뽑으려면 특별한 함수가 필요한데 어디서 시작해야 할지 모릅니다. PromQL을 모르면 Prometheus는 데이터 창고에 불과하고 실제 운영 판단에 쓰이지 못합니다. Prometheus는 자체 쿼리 언어 PromQL을 사용하며, 시계열 데이터에 특화된 몇 가지 핵심 함수를 익히면 대부분의 운영 질문에 답할 수 있습니다. 이 CB에서는 Counter, Gauge, Histogram 타입별 쿼리 패턴과 집계 함수 사용법을 다룹니다. 시계열 데이터에 특화되어 있어 "지난 5분간 초당 에러율", "노드별 메모리 사용률 상위 5개" 같은 쿼리를 간결하게 표현합니다.
메트릭 타입별 쿼리 패턴
![PromQL 메트릭 타입별 쿼리 패턴 — Gauge(오르내리는 현재값)는 직접 조회·avg/max, Counter(단조 증가값)는 rate()·increase()로 변화율(초당 요청 rate(http_requests_total[5m])), Histogram(값의 분포)은 histogram_quantile(0.99, rate(..._bucket[5m]))로 P99 분위수를 계산한다. 집계는 sum(...) by (service)·count by (namespace)·topk(5, ...)처럼 by로 라벨을 묶는다. 타입을 모르면 Gauge에 rate()를 쓰는 실수를 한다](/images/kubernetes/monitoring-prometheus/promql-query-patterns.png) 확대
확대
# --- Gauge (현재 상태값) ---
# 현재 메모리 사용률 (%)
100 - (node_memory_MemAvailable_bytes / node_memory_MemTotal_bytes * 100)

# 파드별 메모리 사용량 (MiB)
container_memory_working_set_bytes{container!=""} / 1024 / 1024

# --- Counter (단조 증가값) — rate()로 변화율 계산 ---
# 초당 HTTP 요청 수
rate(http_requests_total[5m])

# 초당 에러 요청 수 (5xx)
rate(http_requests_total{status=~"5.."}[5m])

# --- Histogram — 분위수 계산 ---
# HTTP 응답시간 P99 (99th percentile)
histogram_quantile(
  0.99,
  rate(http_request_duration_seconds_bucket[5m])
)

# HTTP 응답시간 P50, P95, P99 비교
histogram_quantile(0.50, rate(http_request_duration_seconds_bucket[5m]))
histogram_quantile(0.95, rate(http_request_duration_seconds_bucket[5m]))
histogram_quantile(0.99, rate(http_request_duration_seconds_bucket[5m]))
집계 함수 (by, without)
# 서비스별 초당 요청 수 합계
sum(rate(http_requests_total[5m])) by (service)
# 결과:
# {service="auth"}      → 45.2
# {service="payment"}   → 12.1
# {service="catalog"}   → 150.3

# 네임스페이스별 파드 수
count(kube_pod_info) by (namespace)

# 파드별 CPU 사용률 상위 5개
topk(5, rate(container_cpu_usage_seconds_total{container!=""}[5m]))

# 노드별 CPU 사용률 (전체 대비 %)
100 * (1 - avg by (instance) (
  rate(node_cpu_seconds_total{mode="idle"}[5m])
))
Kubernetes 환경에서 자주 쓰는 쿼리
# Deployment 파드 가용률
kube_deployment_status_replicas_available / kube_deployment_spec_replicas

# 파드 재시작 횟수 증가율 (크래시 루프 감지)
rate(kube_pod_container_status_restarts_total[15m]) * 60

# OOMKilled 파드 감지
kube_pod_container_status_last_terminated_reason{reason="OOMKilled"}

# PersistentVolume 사용률
(
  kubelet_volume_stats_used_bytes /
  kubelet_volume_stats_capacity_bytes
) * 100

# 노드별 할당 가능 CPU 대비 요청 비율
sum(kube_pod_container_resource_requests{resource="cpu"}) by (node) /
sum(kube_node_status_allocatable{resource="cpu"}) by (node) * 100
Grafana에서 PromQL 사용
1. Grafana → Explore (나침반 아이콘) → Prometheus 데이터 소스 선택
2. 쿼리 입력 후 Run Query
3. 시각화: Graph, Stat, Table, Heatmap 등 선택
4. Dashboard에 패널 추가: "Add to Dashboard" 버튼
PrometheusRule — 알림 규칙 코드로 관리
알림 규칙을 UI에서 직접 설정하면 추적이 안 됩니다. PrometheusRule CRD로 알림 규칙을 YAML 파일로 관리하면 Git에서 히스토리를 추적하고, 코드 리뷰를 거치고, CI/CD로 배포할 수 있습니다.
PrometheusRule 정의
# prometheus-rules.yaml
apiVersion: monitoring.coreos.com/v1
kind: PrometheusRule
metadata:
  name: app-alerts
  namespace: default
  labels:
    release: kube-prometheus-stack  # Prometheus가 선택하는 레이블
spec:
  groups:
    - name: availability            # 알림 그룹 이름
      interval: 30s                 # 평가 간격
      rules:
        # 파드 크래시 루프 감지
        - alert: PodCrashLooping
          expr: |
            rate(kube_pod_container_status_restarts_total[15m]) * 60 > 0
          for: 5m                   # 5분간 지속될 때만 발화
          labels:
            severity: critical
            team: platform
          annotations:
            summary: "파드 {{ $labels.pod }}가 크래시 루프 중"
            description: |
              네임스페이스 {{ $labels.namespace }}의 파드
              {{ $labels.pod }} (컨테이너: {{ $labels.container }})가
              지난 15분간 {{ printf "%.1f" $value }}회/분 재시작되고 있습니다.

        # 고에러율 감지
        - alert: HighErrorRate
          expr: |
            sum(rate(http_requests_total{status=~"5.."}[5m])) by (service)
            /
            sum(rate(http_requests_total[5m])) by (service)
            > 0.05
          for: 2m
          labels:
            severity: warning
            team: backend
          annotations:
            summary: "{{ $labels.service }} 에러율 {{ printf \"%.1f\" $value | humanizePercentage }}"
            description: "서비스 {{ $labels.service }}의 5xx 에러율이 5%를 초과했습니다."

        # 높은 응답시간 감지
        - alert: HighResponseTime
          expr: |
            histogram_quantile(
              0.99,
              rate(http_request_duration_seconds_bucket[5m])
            ) > 1.0
          for: 5m
          labels:
            severity: warning
          annotations:
            summary: "{{ $labels.service }} P99 응답시간 1초 초과"
            description: "{{ $labels.service }}의 P99 응답시간이 {{ printf \"%.2f\" $value }}초입니다."

    - name: resources
      rules:
        # 노드 메모리 고갈 임박
        - alert: NodeMemoryPressure
          expr: |
            100 - (
              node_memory_MemAvailable_bytes /
              node_memory_MemTotal_bytes * 100
            ) > 85
          for: 10m
          labels:
            severity: warning
          annotations:
            summary: "노드 {{ $labels.instance }} 메모리 부족"
            description: "메모리 사용률 {{ printf \"%.1f\" $value }}%"

        # PV 용량 임박
        - alert: PersistentVolumeAlmostFull
          expr: |
            (
              kubelet_volume_stats_used_bytes /
              kubelet_volume_stats_capacity_bytes
            ) * 100 > 80
          for: 15m
          labels:
            severity: warning
          annotations:
            summary: "PV {{ $labels.persistentvolumeclaim }} 용량 {{ printf \"%.1f\" $value }}% 사용"
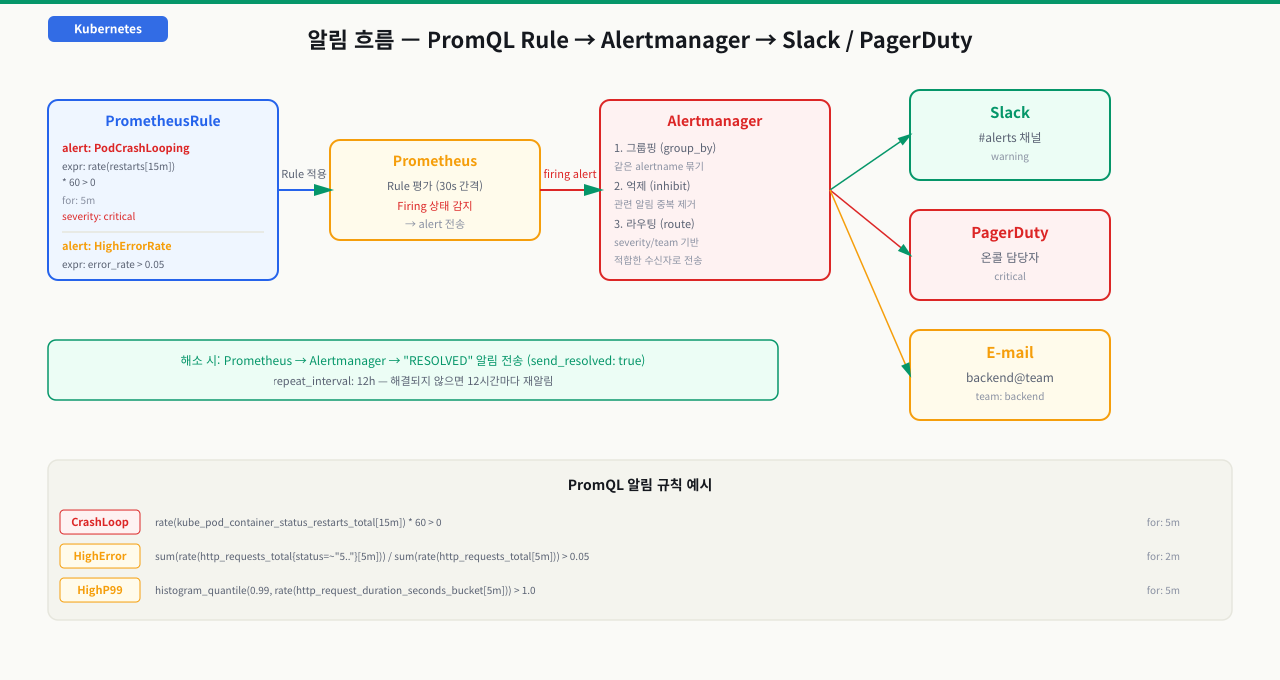
Alertmanager 라우팅 설정
# alertmanager-config.yaml (Helm values에 포함하거나 Secret으로 배포)
alertmanager:
  config:
    global:
      resolve_timeout: 5m
      slack_api_url: "https://hooks.slack.com/services/xxx/yyy/zzz"

    route:
      group_by: ["alertname", "namespace"]
      group_wait: 30s       # 그룹 내 첫 알림 대기 (더 쌓이길 기다림)
      group_interval: 5m    # 같은 그룹 알림 간격
      repeat_interval: 12h  # 해결 안 됐을 때 반복 간격
      receiver: "slack-general"

      routes:
        - match:
            severity: critical
          receiver: "pagerduty-oncall"

        - match:
            team: backend
          receiver: "slack-backend"

    receivers:
      - name: "slack-general"
        slack_configs:
          - channel: "#alerts"
            title: "{{ .GroupLabels.alertname }}"
            text: "{{ range .Alerts }}{{ .Annotations.description }}{{ end }}"

      - name: "slack-backend"
        slack_configs:
          - channel: "#backend-alerts"
            send_resolved: true

      - name: "pagerduty-oncall"
        pagerduty_configs:
          - routing_key: "YOUR_INTEGRATION_KEY"
            severity: "{{ .CommonLabels.severity }}"
kubectl apply -f prometheus-rules.yaml

# 알림 규칙이 Prometheus에 반영됐는지 확인
# http://localhost:9090/rules → "app-alerts" 그룹 확인
실습 — 전체 수집 파이프라인 구성
1단계: kube-prometheus-stack 설치
helm repo add prometheus-community https://prometheus-community.github.io/helm-charts
helm repo update

read -r -s GRAFANA_ADMIN_PASSWORD && echo
export GRAFANA_ADMIN_PASSWORD
helm install kube-prometheus-stack \
  prometheus-community/kube-prometheus-stack \
  --namespace monitoring \
  --create-namespace \
  --set-string grafana.adminPassword="$GRAFANA_ADMIN_PASSWORD" \
  --set grafana.service.type=NodePort \
  --set prometheus.prometheusSpec.serviceMonitorSelectorNilUsesHelmValues=false \
  --wait

kubectl get pods -n monitoring
2단계: 샘플 앱 배포
kubectl apply -f - << 'EOF'
apiVersion: apps/v1
kind: Deployment
metadata:
  name: sample-app
  namespace: default
spec:
  replicas: 2
  selector:
    matchLabels:
      app: sample-app
  template:
    metadata:
      labels:
        app: sample-app
    spec:
      containers:
        - name: app
          image: quay.io/brancz/prometheus-example-app:v0.3.0
          ports:
            - name: http
              containerPort: 8080
---
apiVersion: v1
kind: Service
metadata:
  name: sample-app
  namespace: default
  labels:
    app: sample-app
spec:
  selector:
    app: sample-app
  ports:
    - name: http
      port: 8080
      targetPort: 8080
EOF
3단계: ServiceMonitor 적용 및 수집 확인
kubectl apply -f - << 'EOF'
apiVersion: monitoring.coreos.com/v1
kind: ServiceMonitor
metadata:
  name: sample-app
  namespace: default
  labels:
    release: kube-prometheus-stack
spec:
  selector:
    matchLabels:
      app: sample-app
  endpoints:
    - port: http
      path: /metrics
      interval: 15s
EOF

# Prometheus 포트포워딩 후 타겟 확인
kubectl port-forward -n monitoring \
  svc/prometheus-operated 9090:9090 &

# 1-2분 후 http://localhost:9090/targets에서
# "default/sample-app/0" 타겟이 UP 상태인지 확인
4단계: PromQL로 메트릭 조회
# Prometheus UI (http://localhost:9090/graph)에서 쿼리 실행:

# 샘플 앱의 초당 요청 수
rate(http_requests_total[1m])

# 클러스터 전체 파드 수 (네임스페이스별)
count(kube_pod_info) by (namespace)

# 노드 CPU 사용률
100 * (1 - avg by(instance)(rate(node_cpu_seconds_total{mode="idle"}[5m])))
5단계: Grafana에서 대시보드 확인
# Grafana 포트포워딩
kubectl port-forward -n monitoring \
  svc/kube-prometheus-stack-grafana 3000:80 &

# http://localhost:3000 접속 (admin / 입력한 GRAFANA_ADMIN_PASSWORD)
# Dashboards → Kubernetes / Workloads → namespace=default 선택
# → sample-app Deployment 메트릭 확인
문제 상황
# ServiceMonitor를 적용했는데 Prometheus UI의 /targets에서 보이지 않거나
# "Unknown" 또는 "0/0" 타겟으로 표시됨

# Prometheus Configuration 확인
# http://localhost:9090/config 에서 job_name 목록에 서비스가 없음
원인 1: ServiceMonitor의 레이블이 Prometheus selector와 불일치 (가장 흔함)
# Prometheus가 ServiceMonitor를 선택하는 방식 확인
kubectl get prometheus -n monitoring -o yaml | \
  grep -A 10 "serviceMonitorSelector:"

# 출력 예시:
# serviceMonitorSelector:
#   matchLabels:
#     release: kube-prometheus-stack   ← 이 레이블이 ServiceMonitor에 있어야 함

# ServiceMonitor의 레이블 확인
kubectl get servicemonitor sample-app -n default -o yaml | grep "labels:" -A 5
# labels:
#   release: kube-prometheus-stack   ← 일치 여부 확인

# 해결: ServiceMonitor에 올바른 레이블 추가
kubectl patch servicemonitor sample-app -n default \
  --type=merge \
  -p '{"metadata":{"labels":{"release":"kube-prometheus-stack"}}}'
원인 2: ServiceMonitor의 selector가 Service 레이블과 불일치
# Service의 실제 레이블 확인
kubectl get svc sample-app -n default --show-labels
# NAME         TYPE        CLUSTER-IP   EXTERNAL-IP   PORT(S)   AGE   LABELS
# sample-app   ClusterIP   10.96.x.x    <none>        8080/TCP  5m    app=sample-app

# ServiceMonitor의 selector 확인
kubectl get servicemonitor sample-app -n default -o jsonpath='{.spec.selector}'
# {"matchLabels":{"app":"sample-app-v2"}}   ← "app=sample-app"과 불일치!

# 해결: selector 수정
kubectl patch servicemonitor sample-app -n default \
  --type=merge \
  -p '{"spec":{"selector":{"matchLabels":{"app":"sample-app"}}}}'
원인 3: ServiceMonitor의 port 이름이 Service port 이름과 불일치
# Service의 port 이름 확인
kubectl get svc sample-app -n default -o yaml | grep -A 5 "ports:"
# ports:
#   - name: http          ← Service port 이름
#     port: 8080

# ServiceMonitor의 endpoint port 이름 확인
kubectl get servicemonitor sample-app -n default -o yaml | grep -A 3 "endpoints:"
# endpoints:
#   - port: web           ← "http"와 불일치!

# 해결: ServiceMonitor endpoint port 이름을 "http"로 수정
원인 4: 애플리케이션이 /metrics를 노출하지 않음
# 파드에서 직접 /metrics 엔드포인트 테스트
kubectl exec -n default \
  $(kubectl get pod -n default -l app=sample-app -o name | head -1) \
  -- wget -qO- http://localhost:8080/metrics | head -20

# 출력이 없거나 404이면 앱이 메트릭을 노출하지 않음
# 해결: 앱에 Prometheus 메트릭 라이브러리 추가 필요
Prometheus UI에서 디버깅
1. http://localhost:9090/targets
   → "Unhealthy" 탭에서 오류 메시지 확인
   → "scrape_error: dial tcp ...: connection refused" = 앱이 포트를 안 엶
   → "scrape_error: 404" = /metrics 경로 없음

2. http://localhost:9090/service-discovery
   → "Discovered" 목록에서 ServiceMonitor가 발견됐는지 확인
   → "Dropped" 목록에서 제외된 레이블 확인

3. http://localhost:9090/config
   → ServiceMonitor가 Prometheus 설정으로 변환됐는지 확인
심화 — 수집은 됐는데 '답'이 틀릴 때
심화: histogram_quantile의 진실 — P99는 버킷 경계가 정한다
타겟이 UP이고 데이터도 잘 들어오는데 P99 패널이 이상하게 딱 떨어지는 값(예: 정확히 1.0초)에 붙어 있거나 체감 지연과 동떨어질 때가 있습니다. 여기서 "수집이 됐으니 답도 맞겠지"에서 멈추면 오판합니다. 문제는 수집이 아니라 히스토그램 분위수 계산의 원리에 있습니다.
- 분위수는 버킷 안에서 '추정'한다: Prometheus Histogram은
le(누적 경계) 버킷 카운터와_sum/_count로 이뤄집니다.histogram_quantile(0.99, rate(..._bucket[5m]))은 99번째 백분위가 어느 버킷에 떨어지는지 찾은 뒤 그 버킷 안에서 값이 선형 분포한다고 가정해 보간합니다. 원본 관측값을 저장하는 게 아닙니다. - 정확도는 버킷 설계가 전부다: 가장 큰 유한 버킷이
le=1.0인데 실제 지연이 3초면, 3초짜리 요청은le=+Inf버킷에만 잡히고 분위수는 마지막 유한 경계(1.0)에 눌립니다 — P99가 "정확히 1초"로 보이는 착시. SLO가 200ms인데 버킷이[0.1, 0.5, 1, +Inf]뿐이면 100~500ms를 구분할 해상도가 아예 없습니다. - 분위수는 평균으로 합칠 수 없다: 인스턴스별 P99를
avg()로 평균 내면 틀립니다. 반드시sum by (le) (rate(..._bucket[5m]))로 버킷을 먼저 합친 뒤histogram_quantile을 적용해야 합니다. - window도 함정:
rate(..._bucket[5m])의 window가scrape_interval의 2배보다 작으면 표본이 부족해 그래프에 계단·빈칸이 생깁니다.
즉 "P99가 낮다 = 빠르다"가 아니라, 버킷 해상도가 그 이상을 표현하지 못하는 것일 수 있습니다. 경계를 동적으로 잡는 native histogram이 이 한계를 완화하는 최신 대안입니다.
상황: 사용자들은 느리다는데 P99 패널은 장애 순간에도 정확히 1.000초에서 평평합니다. Prometheus /targets는 UP, _count는 정상적으로 늘고, scrape 오류도 없습니다. 앞의 TroubleCase처럼 '타겟이 안 잡히는' 문제가 아니라, 잘 잡히는데 그래프가 거짓말을 하는 상황입니다.
원인: 앱 히스토그램의 최대 유한 버킷 경계가 le=1.0이었습니다. 실제 P99 지연은 1초를 넘고, 그 요청들은 le=+Inf 버킷에만 집계됩니다. histogram_quantile은 유한 경계를 넘는 구간을 표현할 수 없어 최고 유한 경계(1.0)에 값을 고정합니다. 실제로 빠른 게 아니라 버킷 해상도의 천장에 눌린 것입니다.
진단: 원본 버킷 시계열의 le 값을 나열해 최대 유한 경계를 확인하고, 그 경계를 넘는 요청이 얼마나 많은지, 그리고 버킷과 무관한 평균으로 교차검증합니다.
# +Inf와 최대 유한 버킷(le=1.0)의 증가율 비교 — +Inf가 크게 높으면 상한 초과 다수
sum(rate(http_request_duration_seconds_bucket{le="+Inf"}[5m]))
sum(rate(http_request_duration_seconds_bucket{le="1.0"}[5m]))

# 버킷과 무관한 평균 지연 — 이 값이 이미 1초를 넘으면 히스토그램이 상단을 못 보는 것
sum(rate(http_request_duration_seconds_sum[5m]))
/ sum(rate(http_request_duration_seconds_count[5m]))
평균이 이미 1초를 넘는데 P99가 1초에 고정돼 있으면 버킷 천장 문제로 확정입니다.
해결: 애플리케이션 계측 라이브러리에서 히스토그램 버킷을 워크로드·SLO에 맞게 재정의합니다(예: [.05, .1, .25, .5, 1, 2.5, 5, 10]초)해 상위 구간 해상도를 확보합니다. 버킷을 바꾸면 새 시계열이 생기므로 대시보드 쿼리도 갱신합니다. 여러 인스턴스를 함께 볼 때는 sum by (le)로 먼저 합친 뒤 분위수를 계산해 '평균 분위수' 오류를 피하고, 상한 초과가 잦다면 native histogram 도입을 검토합니다. 지연이 문제인지 로그로 교차 확인하려면 Grafana Loki와 Promtail을 이용한 경량 로그 중앙 수집와 함께 봅니다.
배경
플랫폼팀 가이드: 팀에서 새 마이크로서비스를 배포할 때마다 모니터링 설정이 빠지는 일이 반복됐습니다. 배포 후 장애가 나면 메트릭이 없어 대응이 느렸습니다. 신규 서비스 배포 체크리스트를 만들어 표준화했습니다.
서비스 측 준비 (개발팀)
[ ] 애플리케이션에 Prometheus 메트릭 라이브러리 추가
    - Node.js: prom-client
    - Python: prometheus-client
    - Go: prometheus/client_golang
    - Java: micrometer-prometheus

[ ] /metrics 엔드포인트 노출 (기본 포트 또는 별도 포트)

[ ] 최소 메트릭 세트 정의:
    - http_requests_total (Counter, status/method/path 레이블)
    - http_request_duration_seconds (Histogram)
    - 비즈니스 메트릭 (주문 수, 결제 성공률 등)

[ ] 컨테이너 포트에 이름 부여 (ServiceMonitor에서 이름으로 참조)
    ports:
      - name: http     ← 이름 필수
        containerPort: 8080
      - name: metrics  ← 메트릭 포트 별도 분리 시
        containerPort: 9090
인프라 측 준비 (플랫폼팀)
# 서비스당 최소 3개 리소스 배포:

# 1. Service (레이블 포함)
metadata:
  labels:
    app: new-service
    team: backend

# 2. ServiceMonitor
spec:
  selector:
    matchLabels:
      app: new-service
  endpoints:
    - port: metrics

# 3. PrometheusRule (최소 알림 규칙)
rules:
  - alert: NewServiceDown
    expr: up{job="new-service"} == 0
    for: 2m
  - alert: NewServiceHighErrorRate
    expr: rate(http_requests_total{status=~"5..",service="new-service"}[5m]) > 0.1
    for: 5m
Grafana 대시보드 프로비저닝
# ConfigMap으로 대시보드 자동 프로비저닝
apiVersion: v1
kind: ConfigMap
metadata:
  name: new-service-dashboard
  namespace: monitoring
  labels:
    grafana_dashboard: "1"  # grafana sidecar가 자동으로 로드
data:
  new-service.json: |
    {
      "title": "New Service Metrics",
      "panels": [...]
    }
이 체크리스트를 Helm Chart에 포함하면 서비스 배포와 모니터링 설정이 동시에 이루어집니다.
kube-prometheus-stack Helm 저장소 추가 및 설치
read -r -s GRAFANA_ADMIN_PASSWORD && echo
export GRAFANA_ADMIN_PASSWORD
helm repo add prometheus-community https://prometheus-community.github.io/helm-charts
helm repo update
helm install kube-prometheus-stack \
  prometheus-community/kube-prometheus-stack \
  --namespace monitoring \
  --create-namespace \
  --set-string grafana.adminPassword=\"$GRAFANA_ADMIN_PASSWORD\" \
  --set grafana.service.type=NodePort \
  --set prometheus.prometheusSpec.serviceMonitorSelectorNilUsesHelmValues=false \
  --wait
kubectl get pods -n monitoring예상 출력
NAME                                                     READY   STATUS
alerting-kube-prometheus-stack-alertmanager-0             2/2     Running
kube-prometheus-stack-grafana-xxx                         3/3     Running
prometheus-kube-prometheus-stack-prometheus-0             2/2     Running
샘플 앱 및 Service 배포
kubectl apply -f - <<EOF
apiVersion: apps/v1
kind: Deployment
metadata:
  name: sample-app
  namespace: default
  labels:
    app: sample-app
spec:
  replicas: 2
  selector:
    matchLabels:
      app: sample-app
  template:
    metadata:
      labels:
        app: sample-app
    spec:
      containers:
      - name: app
        image: quay.io/brancz/prometheus-example-app:v0.3.0
        ports:
        - name: http
          containerPort: 8080
---
apiVersion: v1
kind: Service
metadata:
  name: sample-app
  namespace: default
  labels:
    app: sample-app
spec:
  selector:
    app: sample-app
  ports:
  - name: http
    port: 8080
EOF
kubectl get pods -l app=sample-app예상 출력
NAME                          READY   STATUS    RESTARTS
sample-app-xxx-aaa            1/1     Running   0
sample-app-xxx-bbb            1/1     Running   0
ServiceMonitor 생성으로 자동 수집 등록
kubectl apply -f - <<EOF
apiVersion: monitoring.coreos.com/v1
kind: ServiceMonitor
metadata:
  name: sample-app
  namespace: default
  labels:
    release: kube-prometheus-stack
spec:
  selector:
    matchLabels:
      app: sample-app
  endpoints:
  - port: http
    path: /metrics
    interval: 15s
EOF
kubectl get servicemonitor sample-app예상 출력
NAME         AGE
sample-app   5s
Prometheus 포트포워딩 후 타겟 확인
kubectl port-forward -n monitoring svc/prometheus-operated 9090:9090 &
sleep 5
curl -s http://localhost:9090/api/v1/targets | python3 -c "
import sys, json
targets = json.load(sys.stdin)
for t in targets['data']['activeTargets']:
    if 'sample-app' in t.get('scrapePool',''):
        print(t['health'], t['scrapePool'])
"예상 출력
up default/sample-app/0
PromQL로 메트릭 조회
curl -sg 'http://localhost:9090/api/v1/query?query=rate(http_requests_total[1m])' \
| python3 -c "import sys,json; r=json.load(sys.stdin); print('results:', len(r['data']['result']), 'series')"예상 출력
results: 2 series
핵심 요약
| 개념 | 설명 |
|---|---|
| kube-prometheus-stack | Prometheus + Grafana + Alertmanager + exporter 일괄 Helm Chart |
| Prometheus Operator | ServiceMonitor/PrometheusRule CRD를 감시하고 Prometheus 설정을 자동 업데이트 |
| ServiceMonitor | labelSelector로 Service를 선택하여 파드 scrape 대상 자동 등록 |
| PodMonitor | Service 없이 파드를 직접 레이블로 선택하여 scrape |
rate(counter[window]) | Counter의 초당 변화율 계산 — Counter는 항상 rate()로 사용 |
histogram_quantile(φ, ...) | Histogram에서 분위수(P50/P95/P99) 계산 |
sum() by (label) | 레이블 기준으로 메트릭 집계 |
| PrometheusRule | 알림 규칙을 YAML로 코드화 — Git 관리 및 코드 리뷰 가능 |
| Alertmanager | 알림 수신 → 그룹핑 → 라우팅 → Slack/PagerDuty 전송 |
| 타겟 디버깅 | /targets, /service-discovery, /config 순으로 Prometheus UI 확인 |
명령어·단축키 빠른 참조
이 모듈에서 다룬 스택 배포·ServiceMonitor 디버깅·PromQL 명령을 실전 옵션과 함께 모았습니다. 타겟이 안 잡히면 Prometheus UI를 /targets→/service-discovery→/config 순으로 봅니다.
| 명령어/단축키 | 용도 | 자주 쓰는 예 |
|---|---|---|
helm install kube-prometheus-stack | Prometheus+Grafana+Alertmanager 일괄 배포 | --set prometheus.prometheusSpec.serviceMonitorSelectorNilUsesHelmValues=false |
kubectl get pods -n monitoring | 스택 파드 Running/READY 확인 | prometheus StatefulSet은 2/2가 정상 |
kubectl port-forward | Prometheus·Grafana UI 로컬 접속 | kubectl port-forward -n monitoring svc/prometheus-operated 9090:9090 |
kubectl get prometheus -o yaml | serviceMonitorSelector 레이블 확인 | kubectl get prometheus -n monitoring -o yaml | grep -A10 serviceMonitorSelector |
kubectl get servicemonitor -o jsonpath | selector·port 이름 대조 | kubectl get servicemonitor sample-app -o jsonpath='{.spec.selector}' |
kubectl patch servicemonitor | 레이블/selector 불일치 즉시 수정 | kubectl patch servicemonitor sample-app --type=merge -p '{"metadata":{"labels":{"release":"kube-prometheus-stack"}}}' |
kubectl get svc --show-labels | Service 레이블이 selector와 맞는지 확인 | kubectl get svc sample-app -n default --show-labels |
Prometheus UI /targets | scrape 타겟 UP/DOWN·에러 확인 | /service-discovery(발견/드롭)·/config(변환 결과) 순으로 |
PromQL rate() | Counter의 초당 변화율 | rate(http_requests_total{status=~"5.."}[5m]) |
PromQL histogram_quantile() | 히스토그램 분위수(P99) | histogram_quantile(0.99, sum by (le) (rate(http_request_duration_seconds_bucket[5m]))) |
| PromQL 집계 | 레이블 기준 합·상위 N | sum(rate(...)[5m]) by (service) · topk(5, ...) |
curl .../api/v1/query | UI 없이 쿼리 결과 조회 | curl -sg 'http://localhost:9090/api/v1/query?query=rate(http_requests_total[1m])' |
관련 모듈로 더 깊이:
- Grafana Loki와 Promtail을 이용한 경량 로그 중앙 수집 — 메트릭으로 이상을 감지한 뒤 로그로 원인을 추적하는 관측 가능성의 두 번째 기둥
- HPA(Horizontal Pod Autoscaler) 메트릭 기반 파드 확장 — Prometheus가 수집한 CPU·커스텀 메트릭을 오토스케일링 트리거로 연결하는 법
- Kubernetes 장애 원인을 빠르게 격리하는 트러블슈팅 가이드 — 알림이 울린 뒤 describe·events·logs로 실제 원인을 격리하는 후속 절차
- cAdvisor + Prometheus + Grafana 모니터링 실무 — 오케스트레이션 이전, 단일 호스트에서 cAdvisor+Prometheus+Grafana로 컨테이너를 관측하는 법 (Docker 트랙)
다음 모듈 logging-loki에서는 메트릭으로 이상을 감지한 뒤 로그로 원인을 추적하는 관측 가능성의 두 번째 기둥을 다룹니다. Promtail DaemonSet으로 로그를 수집하고 Grafana Explore에서 LogQL로 에러 패턴을 찾는 실습을 진행합니다.