컨테이너 모니터링 — cAdvisor + Prometheus + Grafana
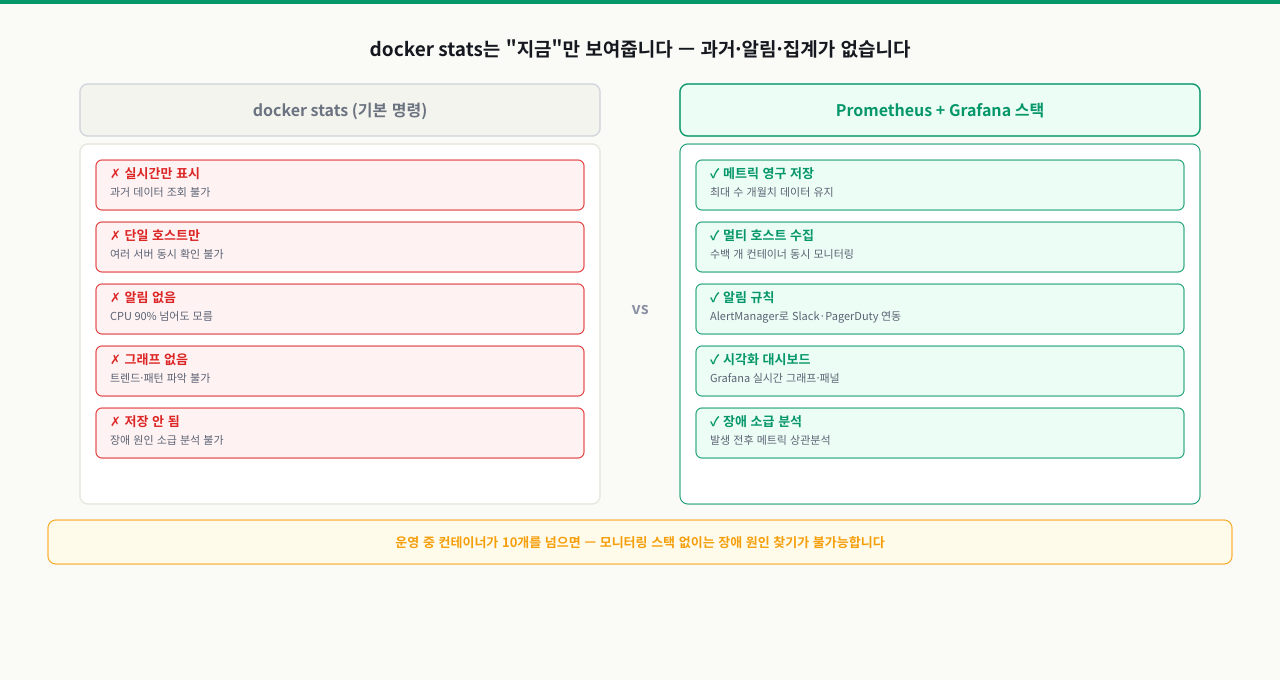
장애가 발생했을 때 현재값만 보는 docker stats로는 "왜" 문제가 생겼는지 설명하기 어렵습니다.
운영에서는 과거 시점의 패턴과 임계치 초과 추세를 근거로 원인을 좁혀야 합니다.
그래서 수집(cAdvisor)·저장(Prometheus)·시각화(Grafana)를 분리한 모니터링 스택이 필요합니다.
이 모듈은 실제 장애 분석에 바로 쓰는 메트릭과 쿼리 중심으로 구성됩니다.
docker stats로 컨테이너 자원 사용량을 볼 수 있지만, 어제 오전 3시에 메모리가 얼마나 사용됐는지, 지난 일주일간 CPU 패턴이 어떠했는지는 알 수 없습니다. 실제 장애는 현재가 아닌 과거의 패턴에서 단서를 찾아야 합니다. cAdvisor로 컨테이너 메트릭을 수집하고, Prometheus로 시계열 저장소에 쌓고, Grafana로 시각화하는 관측 가능성(observability) 스택을 구성해 프로덕션 수준의 모니터링을 경험합니다.
cAdvisor + Prometheus + Grafana 스택을 docker-compose로 구성하고, 실제 컨테이너의 메트릭을 PromQL로 질의하며 대시보드를 만드는 전 과정을 실습합니다. 장애 사후 분석에 바로 적용할 수 있는 실무 쿼리를 중점적으로 다룹니다.
- 1CPU throttle, OOM, 네트워크 포화를 감지하며 컨테이너 모니터링의 필요성을 설명할 수 있다
- 2container_cpu_usage_seconds_total 등 cAdvisor 핵심 메트릭 구조를 이해할 수 있다
- 3Prometheus scrape config와 job을 설정할 수 있다
- 4Grafana 데이터소스를 연결하고 Docker 대시보드(ID 893)를 import할 수 있다
- 5CPU/메모리/네트워크 사용률을 구하는 핵심 PromQL 쿼리를 작성할 수 있다
- 6AlertManager로 임계값 초과 시 알림 규칙을 작성할 수 있다
이 실습은 포트 3000(Grafana), 8080(cAdvisor), 9090(Prometheus)을 사용합니다. 해당 포트가 이미 사용 중이라면 docker-compose.yml에서 호스트 포트를 변경하세요.
docker compose versionmkdir -p ~/monitoring-lab/{prometheus,grafana/provisioning}ss -tulpn | grep -E ':(8080|9090|3000) 'docker pull gcr.io/cadvisor/cadvisor:v0.47.2 && docker pull prom/prometheus:v2.48.0 && docker pull grafana/grafana:10.2.0ARM(Apple Silicon, Raspberry Pi) 환경에서는 --privileged 없이 일부 메트릭이 제한될 수 있습니다
왜 컨테이너 모니터링이 필요한가 — docker stats의 한계
 확대
확대
docker stats의 한계
docker stats는 즉각적인 현재 상태 파악에는 유용하지만, 운영 환경 모니터링 도구로는 다음과 같은 한계가 있습니다.
# 실습 디렉토리 준비
mkdir -p /tmp/docker/part5/exam_25 && cd /tmp/docker/part5/exam_25

docker stats
# CONTAINER   CPU %    MEM USAGE / LIMIT    MEM %    NET I/O       BLOCK I/O
# api_server  45.2%    412MiB / 1GiB        40.2%    1.2MB/800KB   0B/0B
# db          12.8%    256MiB / 2GiB        12.5%    250KB/1.5MB   5MB/2MB

# 문제점:
# 1. 이 순간의 스냅샷만 보임 — 10분 전 CPU 급등은? 알 수 없음
# 2. 히스토리 없음 — 장애 발생 시점 이전 패턴 분석 불가
# 3. 임계값 알림 없음 — 메모리가 90%여도 수동으로 봐야만 앎
# 4. 다중 서버 통합 없음 — 서버 10대면 10번 접속
모니터링 스택의 세 가지 역할
 확대
확대
컨테이너 모니터링으로 감지할 수 있는 주요 이상 징후
| 이상 징후 | 관련 메트릭 | 영향 |
|---|---|---|
| CPU throttling | container_cpu_throttled_seconds_total | 응답 지연 증가 |
| OOM Kill 임박 | container_memory_usage_bytes | 서비스 강제 종료 |
| 네트워크 포화 | container_network_transmit_bytes_total | 패킷 손실, 타임아웃 |
| 디스크 I/O 병목 | container_fs_io_time_seconds_total | DB 쿼리 지연 |
| 컨테이너 재시작 반복 | container_last_seen | CrashLoopBackOff 패턴 |
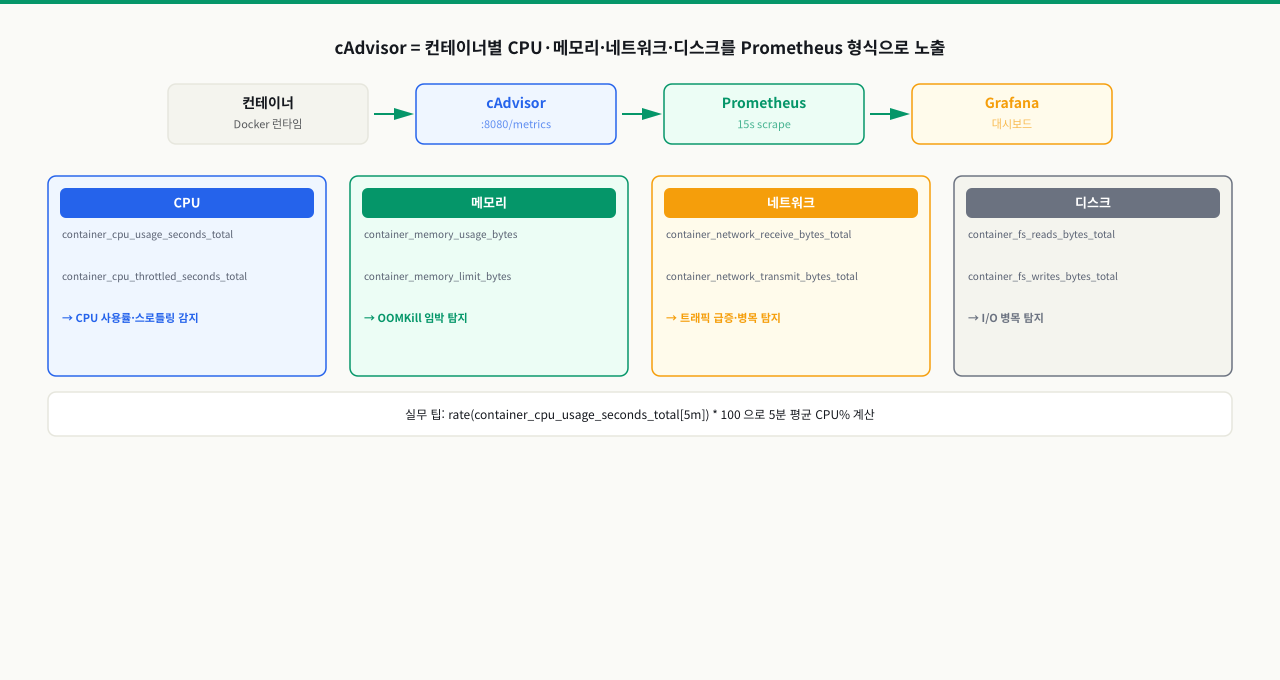
cAdvisor 메트릭 구조와 핵심 메트릭
Grafana 대시보드를 열었습니다. 그래프가 있습니다. 그런데 container_cpu_usage_seconds_total이라는 메트릭 이름이 낯설어서 PromQL 쿼리를 어떻게 써야 할지 막막합니다. cAdvisor가 어떤 이름으로 어떤 메트릭을 노출하는지, 그리고 그 값이 실제로 무엇을 의미하는지를 모르면 쿼리를 작성할 수 없습니다. 이 ConceptBlock에서는 cAdvisor가 수집하는 핵심 메트릭의 이름과 구조, 그리고 실제 값을 해석하는 방법을 다룹니다.
 확대
확대
cAdvisor가 수집하는 메트릭 체계
cAdvisor가 노출하는 메트릭은 Prometheus 형식(텍스트 기반)으로 /metrics 엔드포인트에서 제공됩니다.
# cAdvisor 메트릭 예시 (http://localhost:8080/metrics)

# CPU 관련
container_cpu_usage_seconds_total{
  container="api_server",
  id="/docker/abc123",
  image="myapp:latest",
  name="api_server"
} 1234.567890 1700000000000

container_cpu_throttled_seconds_total{...} 12.5
container_cpu_cfs_throttled_periods_total{...} 350

# 메모리 관련
container_memory_usage_bytes{...} 432013312
container_memory_working_set_bytes{...} 398458880
container_memory_cache{...} 33554432
container_memory_rss{...} 364904448

# 네트워크 관련
container_network_receive_bytes_total{interface="eth0",...} 1234567890
container_network_transmit_bytes_total{interface="eth0",...} 987654321
container_network_receive_errors_total{...} 0
container_network_transmit_errors_total{...} 0

# 디스크 I/O
container_fs_reads_bytes_total{...} 12345678
container_fs_writes_bytes_total{...} 87654321
메트릭 타입 이해
Counter (누적 카운터):
  container_cpu_usage_seconds_total → 단조 증가, rate() 적용 필요
  container_network_receive_bytes_total → rate()로 초당 바이트 계산

Gauge (현재값):
  container_memory_usage_bytes → 현재 메모리 사용량, 바로 사용 가능
  container_spec_memory_limit_bytes → 설정된 메모리 제한값
핵심 메트릭 레이블 구조
container_memory_usage_bytes{
  container="api_server",    ← 컨테이너 이름 (--name 값)
  image="myapp:1.2.3",       ← 컨테이너 이미지
  id="/docker/abc123...",    ← 컨테이너 ID
  name="api_server"          ← Docker이름 (container와 동일)
}
중요: container="" (빈 문자열) 레이블은 컨테이너 전체 합산값이 아닌 시스템 메트릭입니다. 컨테이너 단위 쿼리 시 container!="" 필터를 추가하세요.
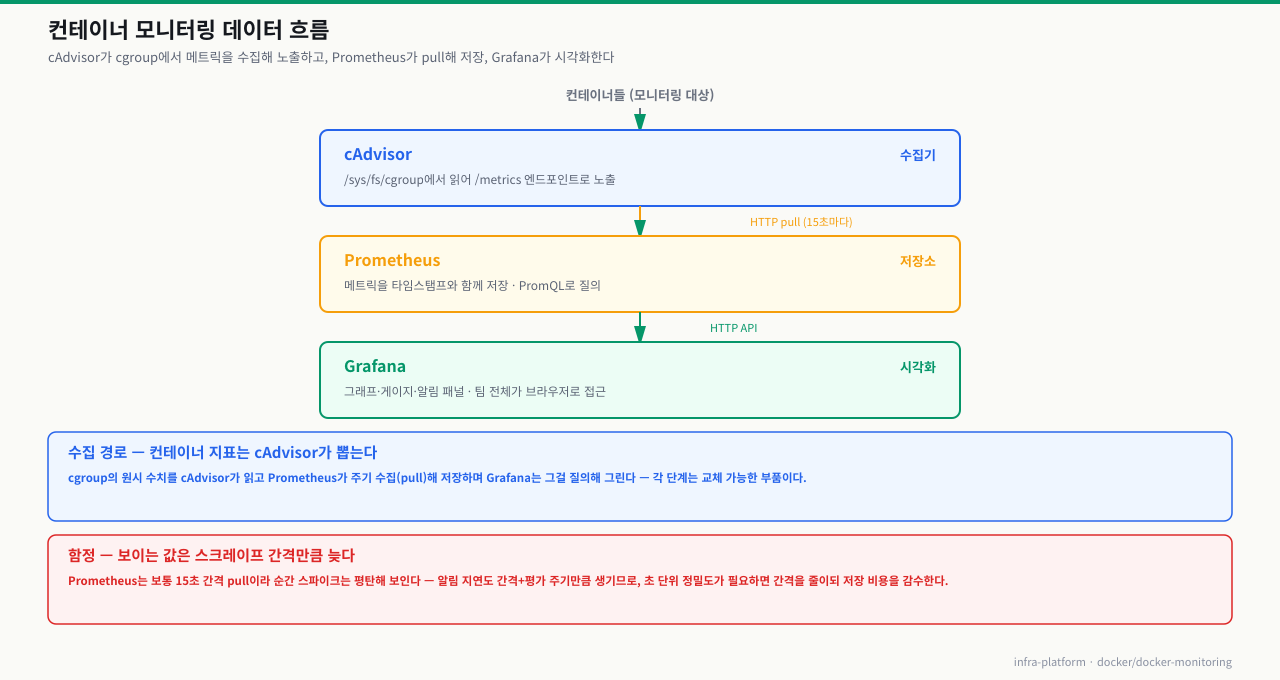
컨테이너 지표가 수집되는 전체 흐름 — cgroup 카운터부터 그래프까지
Grafana 그래프의 CPU 사용률이나 docker stats의 MEM%는 앱이 "내 사용량은 이렇다"고 리포트해서 나오는 값이 아닙니다. 커널이 cgroup에 적어 둔 카운터를 누군가 읽어서 계산한 결과입니다. 이 경로 — cgroup 기록(①) → 리더가 읽음(②) → 누적값을 차이로 환산(③) → 표시·전달(④⑤) — 을 알면, "값이 왜 0인가", "순간값과 평균은 왜 다른가", "메모리가 왜 이렇게 높나"를 어느 칸의 문제인지로 좁힐 수 있습니다.
[커널]  각 컨테이너의 자원 사용을 cgroup 카운터 파일에 계속 기록
   │      /sys/fs/cgroup/... (cpu.stat · memory.current · io.stat ...)
   │
   ① 커널이 CPU 시간·메모리·IO 를 누적 카운터로 갱신   (앱이 리포트하는 게 아님)
   │
   ② 리더가 그 cgroup 파일을 주기적으로 읽음
   │    · docker stats → 데몬이 직접 읽어 터미널로
   │    · cAdvisor    → 파일을 읽어 /metrics 로 노출
   │
   ③ 누적 카운터를 두 시점 차이로 환산              (초당 사용률 = rate/delta)
   │
   ④ 집계 · 레이블 부착 후 표시 또는 전달
   │    · docker stats: 현재 스냅샷을 표로
   │    · cAdvisor: Prometheus 형식 텍스트로 노출
   │
   ⑤ Prometheus 가 pull → TSDB 저장 → Grafana 가 PromQL 로 질의·시각화
   ▼
[운영자]  docker stats(지금 이 순간)   또는   Grafana(시계열 추세)
각 단계에서 무슨 일이 일어나고, 어디서 헷갈리나:
| 단계 | 하는 일 | 여기서 헷갈리면 |
|---|---|---|
| ① cgroup 기록 | 커널이 컨테이너별 CPU 누적 시간·현재 메모리·IO를 cgroup 파일에 강제로 계속 적는다 | 앱 협조가 필요 없다 — 앱이 죽어가도 자원 지표는 남는다. 그래서 "앱은 조용한데 지표만 이상"이 가능 |
| ② 파일 읽기 | docker stats(데몬) 또는 cAdvisor가 cgroup 파일을 주기적으로 읽는다 | cAdvisor가 /sys/fs/cgroup·소켓을 못 읽으면(privileged 미설정) /metrics가 비어 값이 0 — 수집 실패지 앱 문제 아님 |
| ③ 카운터 환산 | CPU처럼 누적(counter) 지표는 두 시점 차이로 초당값을 만든다 | 순간값(docker stats)과 윈도우 평균(rate[5m])은 다른 값 — 스파이크는 짧은 창일수록 크게, 긴 창일수록 뭉개져 보임 |
| ④ 집계·표시 | 레이블을 붙여 docker stats는 표로, cAdvisor는 Prometheus 텍스트로 낸다 | 메모리 usage_bytes는 page cache 포함이라 높게 보임 → OOM 판단은 working_set_bytes로 |
| ⑤ 저장·시각화 | Prometheus가 pull해 시계열로 쌓고 Grafana가 질의한다 | 수집 간격보다 rate 윈도우가 짧으면 샘플 부족으로 그래프가 빔 · 수집 자체도 CPU·저장 오버헤드를 씀 |
즉 "지표가 안 보인다"는 대개 ②(cAdvisor가 cgroup을 못 읽음)의 문제이고, "값이 이상하다"는 ③(순간값·평균 혼동)이나 ④(캐시 포함 메모리)의 해석 문제입니다. 어느 리더가 어디를 읽는지 — docker stats는 지금 이 순간, cAdvisor→Prometheus는 시계열 — 를 먼저 짚으면 무엇을 봐야 할지가 정해집니다.
기본 실습
cAdvisor, Prometheus, Grafana를 하나의 Compose 스택으로 구성합니다.
실습 전 디렉토리와 예제 파일을 먼저 준비합니다.
# 실습 디렉토리 준비
mkdir -p /tmp/docker/part4/exam_4 && cd /tmp/docker/part4/exam_4

# 모니터링 스택 디렉토리 구조 생성
mkdir -p prometheus grafana/dashboards grafana/datasources

# Prometheus 기본 설정 파일 생성
cat > prometheus/prometheus.yml << 'EOF'
global:
  scrape_interval: 15s
scrape_configs:
  - job_name: 'cadvisor'
    static_configs:
      - targets: ['cadvisor:8080']
  - job_name: 'node-exporter'
    static_configs:
      - targets: ['node-exporter:9100']
EOF
이제 실습을 진행합니다.
먼저 Prometheus 설정 파일을 작성합니다.
# ~/monitoring-lab/prometheus/prometheus.yml
global:
  scrape_interval: 15s       # 15초마다 메트릭 수집
  evaluation_interval: 15s   # 15초마다 알림 규칙 평가

# 알림 규칙 파일 경로
rule_files:
  - "alert_rules.yml"

# 스크래핑 대상 설정
scrape_configs:
  # Prometheus 자기 자신 모니터링
  - job_name: "prometheus"
    static_configs:
      - targets: ["localhost:9090"]

  # cAdvisor — 컨테이너 메트릭
  - job_name: "cadvisor"
    static_configs:
      - targets: ["cadvisor:8080"]
    # 유용하지 않은 고빈도 메트릭 제외 (스토리지 절약)
    metric_relabel_configs:
      - source_labels: [__name__]
        regex: "container_(tasks_state|memory_failures_total)"
        action: drop
이어서 알림 규칙 파일을 작성합니다.
# ~/monitoring-lab/prometheus/alert_rules.yml
groups:
  - name: container_alerts
    rules:
      # 메모리 사용률 80% 초과 경고
      - alert: ContainerHighMemoryUsage
        expr: |
          (container_memory_working_set_bytes{container!=""}
          / container_spec_memory_limit_bytes{container!=""}) * 100 > 80
        for: 5m
        labels:
          severity: warning
        annotations:
          summary: "컨테이너 메모리 사용률 높음: {{ $labels.container }}"
          description: "{{ $labels.container }} 컨테이너의 메모리 사용률이 {{ $value | humanize }}%입니다."

      # CPU throttling 감지
      - alert: ContainerCpuThrottling
        expr: |
          rate(container_cpu_throttled_seconds_total{container!=""}[5m]) > 0.1
        for: 10m
        labels:
          severity: warning
        annotations:
          summary: "CPU throttling 감지: {{ $labels.container }}"
          description: "{{ $labels.container }} 컨테이너에서 CPU throttling이 발생하고 있습니다."
이제 docker-compose 파일을 작성합니다.
# ~/monitoring-lab/docker-compose.yml
version: "3.9"

services:
  # 컨테이너 메트릭 수집 에이전트
  cadvisor:
    image: gcr.io/cadvisor/cadvisor:v0.47.2
    container_name: cadvisor
    privileged: true                # cgroup 접근에 필요
    devices:
      - /dev/kmsg:/dev/kmsg
    volumes:
      - /:/rootfs:ro                # 호스트 루트 파일시스템
      - /var/run:/var/run:ro
      - /sys:/sys:ro                # cgroup 정보
      - /var/lib/docker:/var/lib/docker:ro
      - /dev/disk/:/dev/disk:ro
    ports:
      - "8080:8080"
    restart: unless-stopped
    networks:
      - monitoring

  # 시계열 메트릭 저장소
  prometheus:
    image: prom/prometheus:v2.48.0
    container_name: prometheus
    volumes:
      - ./prometheus/prometheus.yml:/etc/prometheus/prometheus.yml:ro
      - ./prometheus/alert_rules.yml:/etc/prometheus/alert_rules.yml:ro
      - prometheus_data:/prometheus
    command:
      - "--config.file=/etc/prometheus/prometheus.yml"
      - "--storage.tsdb.path=/prometheus"
      - "--storage.tsdb.retention.time=15d"  # 15일 데이터 보존
      - "--web.enable-lifecycle"             # API로 설정 리로드 허용
    ports:
      - "9090:9090"
    restart: unless-stopped
    networks:
      - monitoring
    depends_on:
      - cadvisor

  # 시각화 대시보드
  grafana:
    image: grafana/grafana:10.2.0
    container_name: grafana
    volumes:
      - grafana_data:/var/lib/grafana
    environment:
      GF_SECURITY_ADMIN_USER: admin
      GF_SECURITY_ADMIN_PASSWORD: ${GRAFANA_ADMIN_PASSWORD:?set a strong local password}
      GF_USERS_ALLOW_SIGN_UP: "false"
      GF_SERVER_ROOT_URL: "http://localhost:3000"
    ports:
      - "3000:3000"
    restart: unless-stopped
    networks:
      - monitoring
    depends_on:
      - prometheus

  # 부하 발생용 테스트 컨테이너 (메트릭 데이터 생성 목적)
  load-generator:
    image: nginx:alpine
    container_name: load-generator
    deploy:
      resources:
        limits:
          cpus: "0.5"
          memory: 128M
    networks:
      - monitoring

networks:
  monitoring:
    driver: bridge

volumes:
  prometheus_data:
  grafana_data:
cd ~/monitoring-lab
# 이 셸에서 Compose와 뒤의 Grafana API가 함께 사용할 비밀번호를 입력합니다.
read -r -s GRAFANA_ADMIN_PASSWORD
export GRAFANA_ADMIN_PASSWORD
docker compose up -d

# 기동 확인
docker compose ps
# cadvisor     ... running   0.0.0.0:8080->8080/tcp
# prometheus   ... running   0.0.0.0:9090->9090/tcp
# grafana      ... running   0.0.0.0:3000->3000/tcp
docker compose up -dPrometheus가 cAdvisor에서 메트릭을 정상적으로 수집하는지 확인하고, 핵심 PromQL 쿼리를 실습합니다.
# Prometheus UI: http://localhost:9090

# 타겟 상태 API로 확인
curl -s http://localhost:9090/api/v1/targets | \
  python3 -m json.tool | grep -E '"health"|"job"|"scrapeUrl"'

# 정상 출력 예시:
# "health": "up",
# "job": "cadvisor",
# "scrapeUrl": "http://cadvisor:8080/metrics",
Prometheus UI(http://localhost:9090)에서 다음 PromQL 쿼리를 실행합니다.
CPU 사용률 쿼리: cAdvisor 메트릭으로 컨테이너별 CPU 사용률을 계산합니다.
# 모든 컨테이너의 초당 CPU 사용률 (코어 단위)
rate(container_cpu_usage_seconds_total{container!=""}[5m])

# 특정 컨테이너 CPU 사용률
rate(container_cpu_usage_seconds_total{name="load-generator"}[5m])

# CPU 사용률 % (CPU 코어 수 대비)
rate(container_cpu_usage_seconds_total{container!=""}[5m])
* 100

# CPU throttling 비율 (0~1, 높을수록 성능 제한 중)
rate(container_cpu_throttled_seconds_total{container!=""}[5m])
/
rate(container_cpu_usage_seconds_total{container!=""}[5m])
메모리 사용률 쿼리: 메모리 한도 대비 실제 사용량의 비율을 구합니다.
# 컨테이너별 현재 메모리 사용량 (바이트)
container_memory_working_set_bytes{container!=""}

# 메모리 제한 대비 사용률 (%)
(
  container_memory_working_set_bytes{container!=""}
  /
  container_spec_memory_limit_bytes{container!=""}
) * 100

# 메모리 사용량 MB 단위로 표시
container_memory_working_set_bytes{container!=""} / 1024 / 1024

# RSS 메모리 (실제 물리 메모리 점유)
container_memory_rss{container!=""} / 1024 / 1024
네트워크 I/O 쿼리: 컨테이너별 수신/송신 바이트를 확인합니다.
# 초당 수신 바이트 (KB/s 단위)
rate(container_network_receive_bytes_total{container!=""}[5m]) / 1024

# 초당 송신 바이트 (KB/s 단위)
rate(container_network_transmit_bytes_total{container!=""}[5m]) / 1024

# 네트워크 오류율
rate(container_network_receive_errors_total{container!=""}[5m])
+
rate(container_network_transmit_errors_total{container!=""}[5m])
복합 분석 쿼리: 여러 메트릭을 조합해서 이상 징후를 탐지합니다.
# 메모리 사용량 상위 5개 컨테이너
topk(5, container_memory_working_set_bytes{container!=""})

# 최근 5분간 CPU를 가장 많이 사용한 컨테이너
topk(3, rate(container_cpu_usage_seconds_total{container!=""}[5m]))

# 메모리 제한이 설정된 컨테이너 중 80% 이상 사용 중인 것
(
  container_memory_working_set_bytes{container!=""}
  /
  container_spec_memory_limit_bytes{container!=""} > 0
) * 100 > 80
curl http://localhost:9090/api/v1/targetsGrafana에 Prometheus 데이터소스를 연결합니다.
# Compose를 올린 동일한 셸의 GRAFANA_ADMIN_PASSWORD를 사용합니다.
# Grafana API로 데이터소스 자동 설정 (UI 대신 자동화)
curl -X POST \
  -H "Content-Type: application/json" \
  --user "admin:$GRAFANA_ADMIN_PASSWORD" \
  http://localhost:3000/api/datasources \
  -d '{
    "name": "Prometheus",
    "type": "prometheus",
    "url": "http://prometheus:9090",
    "access": "proxy",
    "isDefault": true
  }'

# 출력 예시:
# {"datasource":{"id":1,"name":"Prometheus",...},"id":1,"message":"Datasource added"}
UI로 확인하려면 http://localhost:3000 접속 후:
- 설치 시 설정한 관리자 계정과 비밀번호로 로그인(예제 비밀번호를 운영에서 재사용하지 않음)
- 왼쪽 메뉴 → Connections → Data sources
- "Prometheus" 데이터소스가 보이면 클릭 → "Save & test" 버튼 클릭
- "Successfully queried the Prometheus API." 메시지 확인
# 데이터소스 연결 상태 API 확인 (비밀번호를 명령·셸 기록에 직접 쓰지 않음)
curl -s --user "admin:$GRAFANA_ADMIN_PASSWORD" \
  http://localhost:3000/api/datasources/1/health | python3 -m json.tool
# {
#   "message": "Successfully queried the Prometheus API.",
#   "status": "OK"
# }
open http://localhost:3000커뮤니티에서 만든 Docker 모니터링 대시보드를 import합니다.
# Grafana API로 대시보드 ID 893 import 자동화
curl -X POST \
  -H "Content-Type: application/json" \
  --user "admin:$GRAFANA_ADMIN_PASSWORD" \
  http://localhost:3000/api/dashboards/import \
  -d '{
    "gnetId": 893,
    "overwrite": true,
    "inputs": [
      {
        "name": "DS_PROMETHEUS",
        "type": "datasource",
        "pluginId": "prometheus",
        "value": "Prometheus"
      }
    ]
  }'
UI로 import하려면:
- Grafana → Dashboards → Import
- "Import via grafana.com" 입력란에
893입력 - Load 클릭
- Prometheus 데이터소스 선택 → Import 클릭
# 추가 유용한 대시보드 ID
# 1860: Node Exporter Full (호스트 OS 메트릭)
# 11074: Node Exporter for Prometheus (간결 버전)
# 15759: Docker Container & Host Metrics

# 대시보드 목록 확인
curl -s --user "admin:$GRAFANA_ADMIN_PASSWORD" \
  "http://localhost:3000/api/search?type=dash-db" | \
  python3 -c "import json,sys; [print(d['title'], d['url']) for d in json.load(sys.stdin)]"
대시보드에서 확인할 수 있는 주요 패널:
- 컨테이너별 CPU 사용률 그래프
- 메모리 사용량 및 제한 대비 현황
- 네트워크 수신/송신 바이트
- 컨테이너 수와 상태
curl -X POST --user admin:$GRAFANA_ADMIN_PASSWORD http://localhost:3000/api/dashboards/import실무에서 자주 사용하는 패널을 직접 만들어봅니다.
Grafana → Dashboards → New Dashboard → Add visualization 으로 패널을 추가합니다.
패널 1: 컨테이너 메모리 사용률 게이지 — 각 컨테이너의 메모리 사용률을 실시간으로 표시합니다.
# 쿼리 (Gauge 패널 타입 추천)
(
  container_memory_working_set_bytes{name="load-generator"}
  /
  container_spec_memory_limit_bytes{name="load-generator"}
) * 100

# 패널 설정:
# Unit: Percent (0-100)
# Threshold: 80 (주황), 90 (빨강)
패널 2: CPU 사용률 시계열 그래프 — 시간에 따른 CPU 사용 추이를 확인합니다.
# 쿼리 (Time series 패널 타입)
sum by (name) (
  rate(container_cpu_usage_seconds_total{container!="",name!=""}[5m])
) * 100

# Legend: {{name}}
# Unit: Percent (0-100)
패널 3: 네트워크 I/O 현황 — 컨테이너의 네트워크 트래픽을 모니터링합니다.
# 수신 (bytes/sec)
sum by (name) (
  rate(container_network_receive_bytes_total{container!=""}[5m])
)

# 송신 (bytes/sec)
sum by (name) (
  rate(container_network_transmit_bytes_total{container!=""}[5m])
)

# 패널 설정:
# Unit: bytes/sec
# 두 쿼리를 같은 패널에 추가 (A: 수신, B: 송신)
패널 4: OOM Kill 발생 컨테이너 추적 — 메모리 초과로 강제 종료된 컨테이너를 찾습니다.
# OOM Kill 이벤트 발생률
increase(container_oom_events_total{container!=""}[1h])
# 대시보드 저장
# Grafana UI에서 Save dashboard → 이름: "컨테이너 모니터링" → Save
open http://localhost:3000/dashboard/new- cAdvisor/Prometheus/Grafana 각 컴포넌트가 정상 기동되고 타겟이 UP 상태인가?
- CPU·메모리·네트워크 핵심 쿼리를 직접 실행해 값 해석까지 확인했는가?
- 대시보드 저장 후 재접속해도 동일 지표가 지속적으로 갱신되는가?
- [읽기 순서 — 원칙 A] docker stats 출력은 CPU% → MEM USAGE/LIMIT → NET I/O → BLOCK I/O 순으로 확인한다. CPU%가 첫 번째 필터이고, 이상이 없으면 MEM을 본다.
- [수치 판단 기준 — 원칙 B] CPU%: 80% 이상 지속 시 리소스 제한 필요. 100% 이상(멀티코어 합산)이면 스로틀링 발생 중. MEM%: 85% 이상이면 OOM 위험 모니터링 강화, 95% 이상이면 즉시 조치.
- [조합 해석 — 원칙 C] CPU%가 낮은데 응답이 느리면 BLOCK I/O를 확인한다(디스크 병목). MEM%가 높고 CPU%도 높으면 메모리 부족으로 스왑이 발생 중일 가능성이 크다.
트러블슈팅
증상
# cAdvisor 로그 확인
docker logs cadvisor 2>&1 | tail -20
# E0101 00:00:05.123456  1 manager.go:312]
#   Failed to create container manager:
#   failed to get cgroup subsystems: failed to read cgroup mounts:
#   open /sys/fs/cgroup/cpu/cpuacct.usage: permission denied

# 또는 /metrics 엔드포인트에 메트릭이 거의 없는 경우
curl http://localhost:8080/metrics | grep container_cpu | wc -l
# 0  ← 정상이면 수십 개 이상 있어야 함
원인 분석
# cAdvisor 컨테이너 설정 확인
docker inspect cadvisor --format '{{.HostConfig.Privileged}}'
# false  ← privileged 미설정!

# 필요한 볼륨 마운트 확인
docker inspect cadvisor --format '{{range .HostConfig.Binds}}{{.}}{{"\n"}}{{end}}'
# /var/run/docker.sock이 누락되어 있거나
# /sys가 마운트되지 않은 경우
해결 방법
docker-compose.yml에 다음 설정이 반드시 포함되어야 합니다.
cadvisor:
  image: gcr.io/cadvisor/cadvisor:v0.47.2
  privileged: true        # ← 반드시 필요!
  devices:
    - /dev/kmsg:/dev/kmsg  # ← 반드시 필요!
  volumes:
    - /:/rootfs:ro
    - /var/run:/var/run:ro
    - /sys:/sys:ro          # ← cgroup 파일시스템 접근
    - /var/lib/docker:/var/lib/docker:ro
    - /dev/disk/:/dev/disk:ro
# 수정 후 재생성
docker compose up -d --force-recreate cadvisor

# 정상 수집 확인
curl -s http://localhost:8080/metrics | grep "container_cpu_usage_seconds_total" | head -3
# container_cpu_usage_seconds_total{...} 1234.56
보안 고려사항: privileged: true는 컨테이너에 호스트 수준의 권한을 부여합니다. cAdvisor는 신뢰할 수 있는 이미지이지만, 모니터링 네트워크를 외부에서 접근하지 못하도록 방화벽으로 보호하세요.
증상
# Prometheus UI → Status → Targets 에서
# cadvisor (1/1 up) → DOWN 으로 표시

# API로 타겟 상태 확인
curl -s http://localhost:9090/api/v1/targets | \
  python3 -c "
import json, sys
data = json.load(sys.stdin)
for t in data['data']['activeTargets']:
    print(t['labels']['job'], t['health'], t.get('lastError',''))
"
# cadvisor  down  Get \"http://cadvisor:8080/metrics\": dial tcp: connection refused
원인 1: cAdvisor 컨테이너가 실행 중이 아님
docker compose ps cadvisor
# cadvisor  Exited (1) ← 실행 실패!

docker logs cadvisor
# 오류 메시지 확인
원인 2: Prometheus가 cAdvisor에 도달하지 못함 (네트워크 분리)
# Prometheus 컨테이너에서 cAdvisor에 직접 접근 시도
docker exec prometheus \
  wget -qO- http://cadvisor:8080/metrics | head -5

# 오류 발생 시 네트워크 설정 확인
docker inspect prometheus --format \
  '{{range $k,$v := .NetworkSettings.Networks}}{{$k}} {{end}}'
# monitoring

docker inspect cadvisor --format \
  '{{range $k,$v := .NetworkSettings.Networks}}{{$k}} {{end}}'
# bridge  ← prometheus와 다른 네트워크!
# 해결: docker-compose.yml에서 동일 네트워크 연결 확인
services:
  cadvisor:
    networks:
      - monitoring  # ← prometheus와 같은 네트워크

  prometheus:
    networks:
      - monitoring  # ← 동일해야 함

networks:
  monitoring:
    driver: bridge
원인 3: prometheus.yml의 타겟 주소 오류
# 잘못된 설정 예시
scrape_configs:
  - job_name: "cadvisor"
    static_configs:
      - targets: ["localhost:8080"]  # ← 컨테이너 내부에서 localhost는 Prometheus 자신!

# 올바른 설정
scrape_configs:
  - job_name: "cadvisor"
    static_configs:
      - targets: ["cadvisor:8080"]  # ← 컨테이너 이름으로 지정
# 설정 변경 후 Prometheus 설정 핫 리로드 (재시작 불필요)
curl -X POST http://localhost:9090/-/reload

# 타겟 상태 재확인
curl -s http://localhost:9090/api/v1/targets | python3 -m json.tool | grep health
# "health": "up"  ← 정상 복구
심화 — 값은 수집되는데 rate() 그래프가 비어 보일 때
심화: rate()가 빈 그래프를 주는 이유 — 스크레이프 간격·윈도우·카운터 리셋
타겟이 UP이고 /metrics에도 값이 멀쩡히 있는데 rate() 그래프만 비거나 끊기는 일이 있습니다. 이건 수집 문제가 아니라 카운터를 시계열로 계산하는 방식을 한 겹 더 알아야 풀립니다.
- rate는 윈도우 안 샘플의 기울기입니다: rate(metric[5m])는 5분 범위 안에 들어온 카운터 샘플들로 초당 증가율을 구합니다. 계산하려면 윈도우 안에 최소 2개 이상의 샘플이 있어야 합니다.
- 윈도우는 스크레이프 간격의 4배 이상: scrape_interval이 15초인데 rate(...[30s])처럼 윈도우가 수집 간격의 4배 미만이면, 윈도우 안 샘플이 한두 개뿐이라 결과가 비거나 들쭉날쭉합니다. 15초 수집이면 1분 이상, 관례적으로 5분 윈도우를 씁니다.
- 컨테이너 재시작은 시계열을 끊습니다: 컨테이너가 재시작되면 container_cpu_usage_seconds_total이 0부터 다시 시작하고, 더 중요하게는 컨테이너 id 레이블이 바뀝니다. 그러면 기존 시계열이 끝나고 새 시계열이 생겨 그래프가 뚝 끊겨 보입니다.
- 집계로 단절을 흡수합니다: 컨테이너 단위로 볼 때 sum by (name)으로 묶으면, id가 바뀌어도 같은 이름으로 합산돼 그래프가 이어집니다.
정리하면 값은 있는데 그래프가 빈다의 범인은 대개 너무 짧은 rate 윈도우이거나 재시작으로 인한 시계열 단절입니다.
상황: Prometheus 타겟은 UP이고 /metrics에서 container_cpu_usage_seconds_total 값도 보입니다. 그런데 이 메트릭을 rate()로 그리면 그래프가 군데군데 비거나 끊겨, 사용률 추이를 읽을 수가 없습니다.
원인: 두 가지가 겹쳤습니다. 첫째, rate 윈도우가 수집 간격 대비 짧아 어떤 구간엔 계산에 쓸 샘플이 부족했습니다. 둘째, 문제의 컨테이너가 이따금 재시작되면서 id 레이블이 바뀌어 원시 시계열이 끊겼습니다. 수집은 정상인데 계산·시계열 연속성에서 깨진 것입니다.
진단: scrape_interval을 확인하고(예: 15초) rate 윈도우가 그 4배 이상인지 봅니다. Prometheus에서 원시 카운터를 그대로 그려 값이 계단식으로 이어지는지, 끊긴 시각이 컨테이너 재시작 시각과 일치하는지 대조합니다.
해결: rate 윈도우를 1분 이상(보통 5분)으로 늘려 샘플 부족을 없앱니다. 컨테이너 단위 그래프는 sum by (name)으로 묶어 id 단절을 흡수합니다. 만약 재시작 자체가 잦다면 그것은 그래프 문제가 아니라 크래시 루프 신호이므로 재시작 원인을 따로 조사합니다(requests와 limits 적정 값 계산과 CPU 스로틀링 대처).
실무 맥락
cAdvisor 수집 메트릭과 PromQL 실시간 CPU 연산 쿼리 구조
모니터링 실무에서 cAdvisor는 각 컨테이너 데몬의 하드웨어 수준 리소스 지표를 수집해 Prometheus 호환 텍스트 메트릭으로 제공합니다. SRE는 이를 기반으로 실시간 CPU 사용률이나 메모리 오버헤드를 추적하는 고도의 쿼리를 다룰 줄 알아야 합니다.
-
cAdvisor 수집 핵심 메트릭:
container_cpu_usage_seconds_total: 모든 CPU 코어에서 컨테이너가 누적 사용한 CPU 시간(초).container_memory_usage_bytes: 컨테이너가 실제 점유 중인 물리 메모리 바이트 크기.container_network_transmit_bytes_total: 컨테이너가 송신한 네트워크 바이트 누적치.
-
실시간 CPU 사용률 계산을 위한 PromQL 쿼리:
PROMQLrate(container_cpu_usage_seconds_total{name="web"}[5m])container_cpu_usage_seconds_total: 수집 대상 메트릭으로, 계속 증가하는 누적(Counter) 지표입니다.{name="web"}: 컨테이너 명이web인 프로세스만 타겟팅하는 필터 레이블입니다.[5m]: 지난 5분간의 시계열 데이터 윈도우 범위를 지정합니다.rate(...): 누적 카운터 지표의 지난 5분간 초당 변화율(기울기)을 연산하여, 실제 컨테이너의 실시간 CPU 사용률을 정확하게 백분율 단위로 도출해 내는 핵심 수학 함수입니다.
실제 장애 시나리오
새벽 3시 30분에 API 서버의 응답이 느려지더니 4시에 서비스가 완전히 멈췄습니다. 온콜 엔지니어가 새벽에 깨어 서버를 재시작했지만, 원인을 모르면 다음날 같은 장애가 반복됩니다.
Prometheus 데이터가 있을 때와 없을 때의 차이: 스크레이핑 주기와 보존 기간에 따라 쿼리 결과가 달라집니다.
[모니터링 없는 경우]
"새벽 4시에 서버가 죽었어요. 메모리가 부족했던 것 같아요."
→ 원인 추정 불가, 재발 방지 불가

[Prometheus+Grafana가 있는 경우]
새벽 3시 30분: api-server 메모리 사용률 75% (정상 수준 45%)
새벽 3시 45분: 메모리 사용률 85%, CPU throttling 시작
새벽 4시 00분: 메모리 사용률 98%, OOM Kill 발생 → 재시작
새벽 4시 02분: 재시작 후 메모리 다시 빠르게 증가 → 메모리 누수!

→ 특정 엔드포인트 호출 후 메모리 반환 안 됨 → 코드 버그 찾아 수정
장애 사후 분석(Post-Mortem) PromQL 쿼리
# 장애 발생 1시간 전부터 메모리 추이 조회
# (Grafana에서 시간 범위를 "2024-01-15 03:00 ~ 04:30"으로 설정 후)
container_memory_working_set_bytes{name="api-server"}

# 메모리 증가 속도 (분당 증가 바이트)
increase(container_memory_working_set_bytes{name="api-server"}[1m])

# 장애 시점 CPU throttling 현황
rate(container_cpu_throttled_seconds_total{name="api-server"}[1m])
알림 규칙으로 사전 감지
모니터링의 진정한 가치는 장애 후 분석보다 사전 감지와 자동 알림에 있습니다.
# prometheus/alert_rules.yml — 실무 수준 알림 규칙

groups:
  - name: container_alerts
    rules:
      # 메모리 급증 감지 (15분 내 50% 이상 증가)
      - alert: ContainerMemoryRapidIncrease
        expr: |
          (
            container_memory_working_set_bytes{container!=""}
            - container_memory_working_set_bytes{container!=""} offset 15m
          )
          / container_memory_working_set_bytes{container!=""} offset 15m
          > 0.5
        for: 5m
        labels:
          severity: warning
        annotations:
          summary: "메모리 급증 감지: {{ $labels.name }}"
          description: |
            {{ $labels.name }} 컨테이너의 메모리가 15분 내에
            {{ $value | humanizePercentage }} 증가했습니다.
            메모리 누수 가능성을 확인하세요.

      # OOM Kill 발생 즉시 알림
      - alert: ContainerOOMKilled
        expr: |
          increase(container_oom_events_total{container!=""}[5m]) > 0
        labels:
          severity: critical
        annotations:
          summary: "OOM Kill 발생: {{ $labels.name }}"
          description: |
            {{ $labels.name }} 컨테이너가 메모리 초과로 강제 종료되었습니다.

      # 컨테이너 반복 재시작 (1시간 내 3회 이상)
      - alert: ContainerRestartingFrequently
        expr: |
          increase(kube_pod_container_status_restarts_total[1h]) > 3
        labels:
          severity: warning
        annotations:
          summary: "컨테이너 반복 재시작: {{ $labels.container }}"
모니터링 스택 운영 팁
# Prometheus 저장 용량 계산 (대략)
# 메트릭 수 × 스크래핑 간격(초) × 보존 기간(초) × 바이트/샘플
# 예: 10,000 메트릭 × 15초 × 15일(1,296,000초) × 2 bytes
# ≈ 약 390GB → 실제로는 압축으로 10~20% 수준

# 저장소 사용량 모니터링
curl -s http://localhost:9090/api/v1/query?query=prometheus_tsdb_storage_blocks_bytes \
  | python3 -c "import json,sys; d=json.load(sys.stdin); print(int(d['data']['result'][0]['value'][1])/1024/1024/1024, 'GB')"

# Prometheus 설정 유효성 검사 (재시작 전 미리 확인)
docker run --rm \
  -v $(pwd)/prometheus:/etc/prometheus \
  prom/prometheus:v2.48.0 \
  promtool check config /etc/prometheus/prometheus.yml
# SUCCESS: /etc/prometheus/prometheus.yml is valid prometheus config file syntax
경보(Alert) 설정과 운영 임계값 기준
 확대
확대
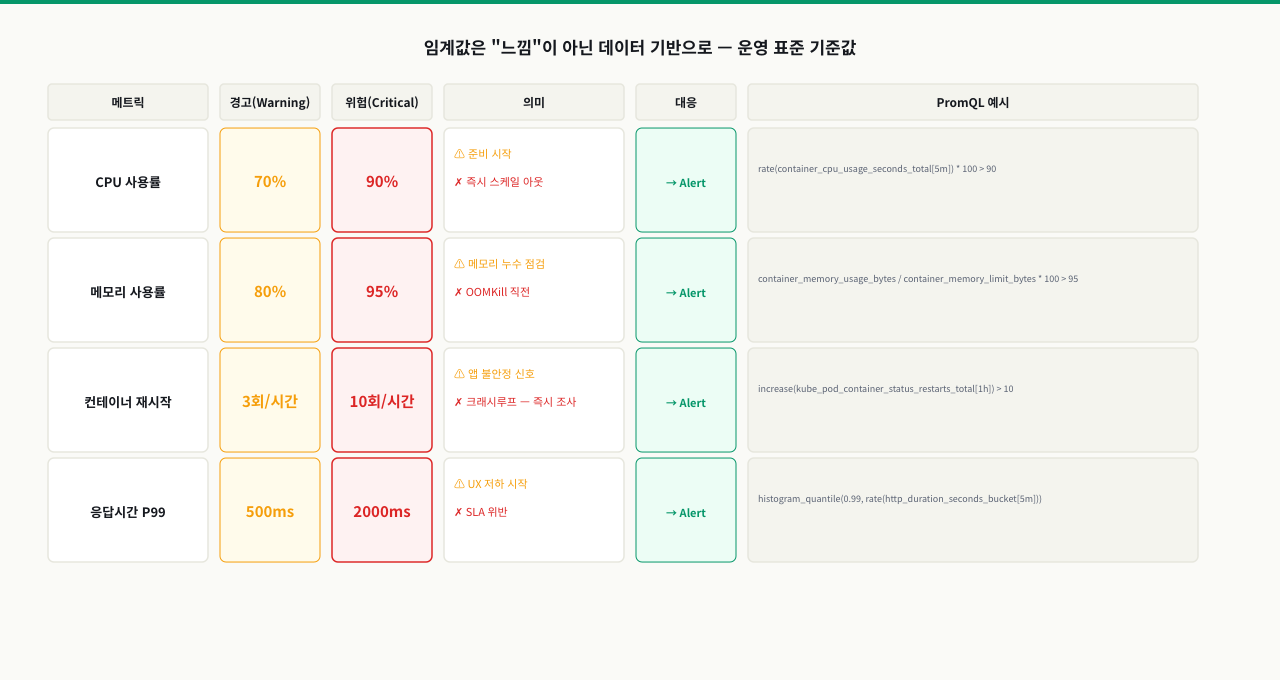
무엇을 언제 알릴 것인가
모니터링 대시보드를 만들어도 아무도 24시간 보고 있지 않습니다. 문제가 생기면 자동으로 알려주는 경보가 필수입니다.
핵심 경보 항목과 임계값 가이드
| 메트릭 | 경고 임계값 | 위험 임계값 | 조치 |
|---|---|---|---|
| 메모리 사용률 | limit의 80% | limit의 95% | 제한 증가 또는 앱 최적화 |
| CPU 사용률 | 80% (5분 지속) | 95% (1분 지속) | 스케일 아웃 또는 제한 조정 |
| 재시작 횟수 | 1시간 내 3회 | 1시간 내 10회 | 앱 오류 원인 조사 |
| unhealthy 상태 | 1회 발생 | 3분 이상 지속 | 즉시 서비스 점검 |
| 컨테이너 중지 | - | 예상치 못한 중지 | 즉시 확인 |
Prometheus 경보 규칙 예시
# prometheus/alerts/container.yml
groups:
  - name: container_alerts
    rules:
      # 메모리 80% 이상 사용 시 경고
      - alert: ContainerMemoryHigh
        expr: |
          (container_memory_usage_bytes{name!="",name!~".*_exporter"}
           / container_spec_memory_limit_bytes{name!="",name!~".*_exporter"}) > 0.80
        for: 2m
        labels:
          severity: warning
        annotations:
          summary: "컨테이너 {{ $labels.name }} 메모리 {{ $value | humanizePercentage }} 사용"
          description: "2분 이상 메모리 80% 초과 — 제한 증가 또는 메모리 누수 점검 필요"

      # 메모리 95% 이상 사용 시 위험
      - alert: ContainerMemoryCritical
        expr: |
          (container_memory_usage_bytes{name!=""}
           / container_spec_memory_limit_bytes{name!=""}) > 0.95
        for: 30s
        labels:
          severity: critical
        annotations:
          summary: "컨테이너 {{ $labels.name }} OOM 임박!"

      # 1시간 내 3회 이상 재시작
      - alert: ContainerRestartingFrequently
        expr: increase(container_start_time_seconds{name!=""}[1h]) > 3
        for: 0m
        labels:
          severity: warning
        annotations:
          summary: "컨테이너 {{ $labels.name }} 1시간 내 {{ $value | printf \"%.0f\" }}회 재시작"

      # CPU 80% 이상 5분 지속
      - alert: ContainerCpuHigh
        expr: |
          rate(container_cpu_usage_seconds_total{name!=""}[5m]) * 100 > 80
        for: 5m
        labels:
          severity: warning
        annotations:
          summary: "컨테이너 {{ $labels.name }} CPU {{ $value | printf \"%.1f\" }}% 사용 중"
docker-compose.yml에 Alertmanager 추가
# monitoring/compose.yml에 추가
services:
  alertmanager:
    image: prom/alertmanager:latest
    ports:
      - "9093:9093"
    volumes:
      - ./alertmanager.yml:/etc/alertmanager/alertmanager.yml

  prometheus:
    image: prom/prometheus:latest
    volumes:
      - ./prometheus.yml:/etc/prometheus/prometheus.yml
      - ./alerts/:/etc/prometheus/alerts/    # 경보 규칙 디렉토리
# alertmanager.yml — Slack 알림 예시
route:
  receiver: slack-notifications

receivers:
  - name: slack-notifications
    slack_configs:
      - api_url: '$SLACK_WEBHOOK_URL'
        channel: '#alerts'
        text: '{{ .CommonAnnotations.summary }}'
핵심 요약
| 개념 | 명령/설정 | 설명 |
|---|---|---|
| cAdvisor 실행 | privileged: true + /sys 볼륨 마운트 | cgroup 접근을 위한 필수 설정 |
| CPU 사용률 | rate(container_cpu_usage_seconds_total[5m]) | 초당 CPU 코어 사용량 (counter → rate 적용) |
| 메모리 사용량 | container_memory_working_set_bytes | 실제 점유 메모리 (gauge, rate 불필요) |
| 메모리 사용률 % | (working_set / spec_limit) * 100 | 제한 대비 사용률 |
| CPU throttling | rate(container_cpu_throttled_seconds_total[5m]) | CPU 제한으로 인한 처리 지연 감지 |
| 네트워크 I/O | rate(container_network_receive_bytes_total[5m]) | 초당 네트워크 수신 바이트 |
| 상위 N개 조회 | topk(5, 메트릭) | 자원 사용량 상위 컨테이너 조회 |
| Prometheus 설정 리로드 | curl -X POST :9090/-/reload | 재시작 없이 설정 변경 반영 |
| 데이터 보존 기간 | --storage.tsdb.retention.time=15d | Prometheus 데이터 보관 기간 설정 |
| 대시보드 ID 893 | Grafana → Import → 893 | Docker 모니터링 커뮤니티 대시보드 |
| docker stats vs Prometheus | 현재값만 vs 시계열 저장 | 장애 분석에는 반드시 시계열 필요 |
명령어·단축키 빠른 참조
이 모듈에서 다룬 docker 관측 명령을 한자리에 모았습니다. cAdvisor·Prometheus 스택을 붙이기 전에도 이 명령들만으로 컨테이너의 현재 상태와 기동 실패 원인을 빠르게 확인할 수 있습니다.
| 명령어/단축키 | 용도 | 자주 쓰는 예 |
|---|---|---|
docker stats | 실행 중 컨테이너 CPU·MEM·NET·BLOCK I/O 실시간 | docker stats(전체) / docker stats api_server db(지정) |
docker stats --no-stream | 한 번만 찍고 종료 — 스크립트·크론용 | docker stats --no-stream --format '{{.Name}} {{.CPUPerc}} {{.MemPerc}}' |
docker inspect --format | 컨테이너 설정값을 Go 템플릿으로 추출 | docker inspect cadvisor --format '{{.HostConfig.Privileged}}' |
docker inspect --format '{{range}}' | 마운트·네트워크 같은 목록형 값 순회 | docker inspect cadvisor --format '{{range .HostConfig.Binds}}{{.}}{{"\n"}}{{end}}' |
docker logs | 컨테이너 표준출력 로그로 기동 실패 원인 확인 | docker logs cadvisor 2>&1 | tail -20 |
docker exec | 실행 중 컨테이너 안에서 진단 명령 실행 | docker exec prometheus wget -qO- http://cadvisor:8080/metrics |
docker compose ps | 모니터링 스택 컨테이너 상태(Exited 여부) | docker compose ps cadvisor |
docker compose up -d | 스택 기동 · 설정 변경 후 재생성 | docker compose up -d --force-recreate cadvisor |
docker stats출력은 CPU% → MEM USAGE/LIMIT → NET I/O → BLOCK I/O 순으로 읽습니다. CPU%가 낮은데 느리면 BLOCK I/O(디스크 병목)를 의심합니다.
관련 모듈로 더 깊이:
- requests와 limits 적정 값 계산과 CPU 스로틀링 대처 — 모니터링으로 관찰하는 CPU throttling·메모리 사용률의 원인인 cgroups 제한
- 컨테이너 로그 유실 방지와 효율적인 실시간 로깅 전략 — 메트릭과 짝을 이루는 로그 수집·로테이션으로 장애 분석을 보강하는 법
- 빌드 자동화와 이미지 태그 배포 파이프라인 구축 — 모니터링 구성을 코드로 관리하고 파이프라인에서 배포하는 자동화
- Prometheus & Node Exporter 연동으로 실시간 대시보드 구축 — 컨테이너 너머 리눅스 호스트·서비스를 같은 Prometheus로 관측하는 법 (Linux 트랙)
다음 모듈에서는 GitHub Actions와 GitLab CI를 활용해 이미지 빌드·태그·레지스트리 푸시까지 자동화하는 CI/CD 파이프라인 구축을 다룹니다.